TRANSMISSION // 2611.14435v1
Why Some Galaxies Look More Lopsided Than Others
Source published
A statistical study of hundreds of disk galaxies finds stronger lopsidedness in later-type, slower-rotating systems. A comparison with a cosmological simulation shows a similar mass-related pattern, but differences in the samples and methods—and the limits of observational correlations—leave the physical explanation open.
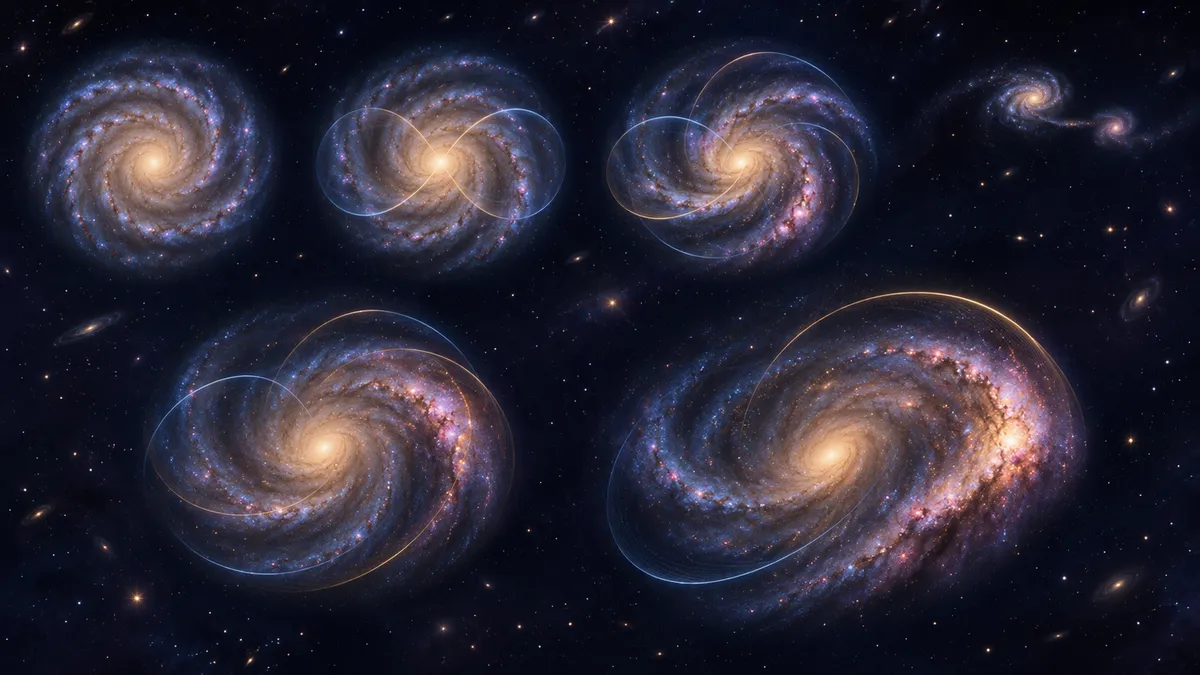
Galaxies are often pictured as orderly spinning disks, but many are subtly uneven: one side may extend farther or contain more light than the other. A new analysis asks how common this lopsidedness is, how it relates to other structures, and what galaxy properties might help explain it.
A spiral galaxy need not be perfectly balanced. Its disk can have a broad asymmetry, with one side more prominent than the other. Astronomers describe this with the m = 1 Fourier mode, or lopsidedness. A separate m = 2 mode captures patterns with two major sides, including bars and two-armed spirals. Measuring both lets researchers ask whether these features vary together—and whether lopsidedness is linked to a galaxy’s structure or rotation.
Abbos Omonov and colleagues analyzed a compilation of published measurements. After identifying and removing duplicate galaxies, they had 606 unique objects. Of these, 442 had a measured lopsidedness amplitude, called A1; 302 of those also had an A2 measurement. The measurements came from 37 studies using Fourier analyses of galaxy light, but the studies did not all use the same radial aperture or measurement conventions.
The researchers compared the observed amplitude distributions with three statistical models. A log-normal distribution—a pattern that can arise when changes multiply rather than simply add—fit both A1 and A2 better than the tested Rayleigh and exponential alternatives. This describes which mathematical curve best fits the compiled data. It does not, on its own, identify the physical process that produced the asymmetries.
The two Fourier modes tended to rise together: galaxies with higher A1 often had higher A2. A fitted relation was A2 = 0.29 A1 + 0.11, with a moderate rank correlation. The positive intercept suggests that A2 can have a contribution even when A1 is small; bars or spiral structure may contribute independently. The association does not establish that one mode causes the other. The authors note that physical coupling and projection effects could both contribute.
Lopsidedness also varied across galaxy types. Median A1 rose from about 0.07 among E/S0 systems to about 0.37 among Sm/Im galaxies—a trend from earlier, more bulge-dominated types toward later types. A2, by contrast, showed no statistically significant trend with morphology in this sample. These are population-level patterns, not rules for every individual galaxy.
Rotation offered another clue. A1 tended to be lower among galaxies with faster gas rotation. In a subset of 246 galaxies with independent stellar-mass estimates, A1 also declined as stellar mass increased. But these properties are intertwined: in a multivariable analysis, rotation and morphology retained associations with A1, while stellar mass did not remain statistically significant once those were accounted for. The mass trend should not be read as evidence that mass itself directly controls lopsidedness.
The team compared the observed mass trend with the IllustrisTNG50-1 cosmological simulation, analyzing simulated galaxies with a Fourier pipeline. The simulation reproduced a similar decline in A1 with stellar mass, but its median A1 was about 1.4 times lower than that of the observed sample. The authors suggest the difference may reflect factors including the compilation’s varied methods and the tendency of some studies to target galaxies already known to be lopsided. The comparison supports a shared trend, but does not show that the simulation captures every relevant process.
The authors interpret weaker asymmetry in massive, fast-rotating disks as evidence that internal dynamics matter, rather than tidal encounters alone setting the observed pattern. They do not rule out tides or uneven gas accretion, which may affect individual galaxies. The catalog is not volume-limited, its measurements combine different apertures and methods, and it lacks the environmental information needed to directly test the role of neighboring galaxies. The authors also note that more galaxies measured in both A1 and A2 would strengthen the analysis of how the modes are related.
This work is available as an arXiv preprint. Its results are based on a compilation with methodological differences, so the reported trends should be understood in that context. The authors make the catalog data and analysis code available, allowing others to inspect and build on the results. The study offers a broad statistical account of how lopsidedness varies; it does not settle why any particular galaxy is asymmetric.
- galaxy morphology
- disk galaxies
- Fourier analysis
- lopsidedness
- galaxy dynamics
- IllustrisTNG
Reviewed cross-references
These connections were reviewed by a model, not independently fact-checked by a human. Similarity does not imply agreement; consult the original papers and the evidence below.
Self-interacting dark matter deepens a galactic bar puzzle in simulations
Shared method: Both studies use Fourier analysis of azimuthal structure: the lopsidedness study measures the m=1 and m=2 amplitudes in a galaxy compilation, while the AIDA-TNG study uses the m=2 component to identify and quantify bars in simulated disks. This is a methodological overlap, not evidence that their results apply to the same populations or address the same physical question.
Model review: · openai-codex/gpt-6-luna
Evidence and provenance
Selected excerpts, not complete papers. PDF extraction can omit figures or damage equations, tables and reading order; sources may be preprints.
2611.14435v1 — Original paper
Excerpt reference:
static/papers/2611.14435v1.md:686-921
Basis: Paper text
Source SHA-256:50240a2fedbfcc9fc4112b07921eca5c364013525c67d29be51ba3460adc2c272611.09852v1 — Original paper
Excerpt reference:
static/papers/2611.09852v1.md:267-367
Basis: Paper text
Source SHA-256:ba8ec725f7baf92a89827ff20d28beb73a26c8245776b1af12a91c5fd21f0cc3
Related reading
Automatically matched by shared topic keywords. These links do not imply that the sources agree or establish a consensus.
Could magnetic fields help explain gas rotation in the Sunflower Galaxy?
Source published
Shared keywords: galaxy dynamics
Can brightness gradients reveal subtle distortions in distant galaxies?
Source published
Shared keywords: galaxy morphology
How to measure cosmic shear without drawing galaxy shapes
Source published
Shared keywords: galaxy morphology
Galaxy Images Offer Clues to Billions of Years of Star Formation
Source published
Shared keywords: galaxy morphology
A Transformer’s Arithmetic Circuit Works Despite Local Geometric Distortion
Source published
Shared keywords: fourier analysis