TRANSMISSION // 2611.13791v1
Two imaging methods reveal microwave patterns in a superconducting lattice
Source published
A preprint combines laser scanning and diamond-based magnetic sensing to map a 33-resonator superconducting array, revealing an edge-localized pattern while distinguishing fabrication imperfections from distortions introduced by measurement.
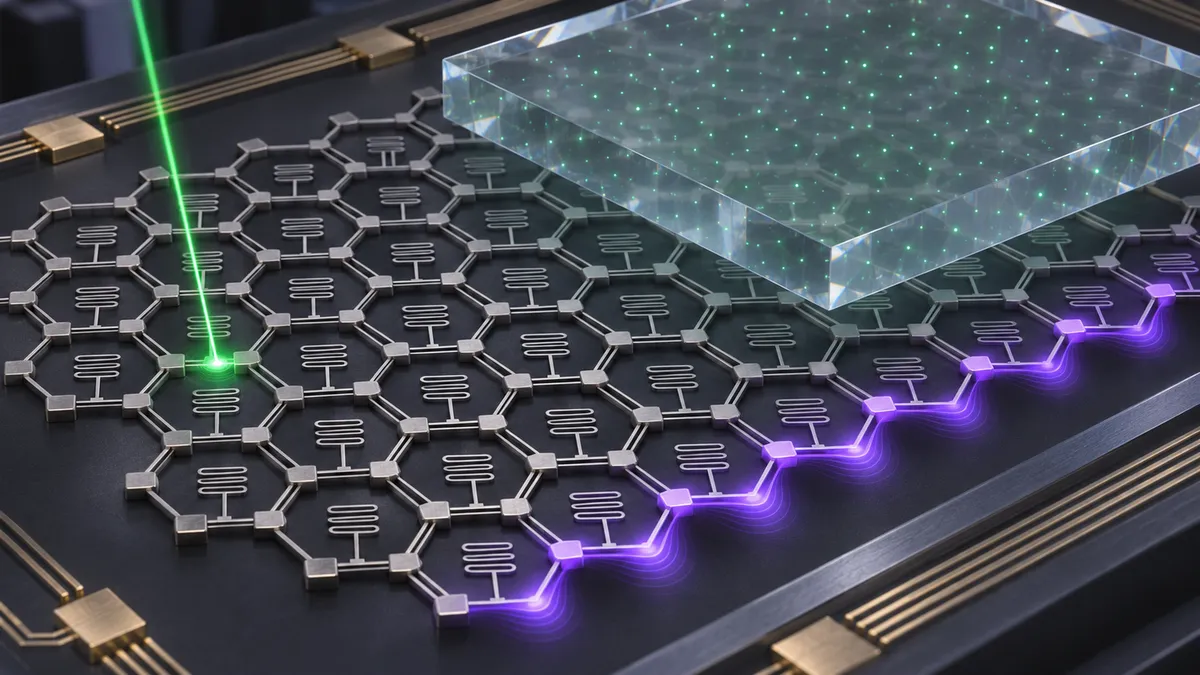
A microwave signal passing through a superconducting circuit can reveal its resonant frequencies without showing where the oscillations actually occur. That missing spatial information matters when researchers want to connect the circuit to other quantum systems. In a new preprint, Benedek Gaál and colleagues at EPFL use two complementary imaging methods to examine a honeycomb array of 33 resonators. Their results show both the intended edge-localized behavior and an important complication: the measuring apparatus can reshape what it appears to reveal.
The array is a network of tiny electrical oscillators, each combining capacitance and inductance. Coupling them together creates collective patterns of oscillation called eigenmodes. Much as different vibrations of a drum have different spatial patterns, these microwave modes distribute their amplitude differently across the circuit.
The researchers fabricated the array from superconducting niobium titanium nitride and measured it at about 5–6 kelvin. Its honeycomb geometry has zigzag boundaries, which can support modes concentrated along the edge. The arrangement resembles graphene mathematically, although the experiment concerns microwave oscillations rather than electrons moving through carbon.
Ordinary microwave transmission measurements showed roughly 14 spectral features associated with modes accessible through the device’s two ports. Other modes produced no visible transmission features. The spectrum broadly agreed with a circuit model, but that agreement alone could not establish whether the oscillations occupied the expected sites.
To obtain spatial maps, the team first scanned a weak, focused green laser across the array. Illumination locally increases electrical losses in the superconducting film. Measuring how each spectral feature changes as the laser moves reveals where the corresponding mode has substantial weight. For modes sharing the same frequency, however, the map combines their contributions rather than resolving each one separately.
The resulting maps broadly matched simulations, including a pattern associated with edge modes. But that pattern appeared less confined to the expected sites than the model predicted. A honeycomb lattice can be divided into two interleaved sets of sites, called sublattices; the zigzag boundary belongs to one of them. The measured preference for that sublattice, expressed as a polarization score, was only about 0.28.
Was the circuit faulty, or was the probe blurring the picture? The authors modeled laser-induced losses extending to neighboring resonators, potentially because the substrate guides some incident light beyond the illuminated spot. They compared simulations with two properties of the measured maps: their left–right asymmetry and how widely the response spread across sites.
Within that model, the observations were consistent with neighboring sites experiencing about one-quarter of the added loss at the targeted site. They also supported an upper bound of approximately 0.3% on variations in individual resonators’ frequencies, corresponding to about 10 megahertz. This is a simulation-dependent inference, not an independent frequency measurement of every resonator. No defect-like localized profiles appeared among the modes accessible through the ports.
The second method used nitrogen-vacancy centers: atomic-scale defects in diamond whose electron spins respond to microwave magnetic fields. The team placed a diamond slab containing these defects above the array. Microwave pulses changed the spin populations, which the researchers read through changes in fluorescence. Under calibrated operating conditions, that contrast provided an approximately proportional indicator of local field amplitude.
These maps measure the driven circuit’s response, rather than the same quantity obtained by laser scanning. They reproduced simulated bulk patterns and an edge-localized response with a sublattice polarization estimate of 0.75, close to the simulated 0.77. That estimate was not corrected for residual fluorescence nonlinearity or variations in the diamond’s distance from the circuit.
Crucially, adding diamond changed the device itself. Its dielectric properties shifted the center frequency from about 3.405 to 2.77 gigahertz. Uneven spacing introduced an approximately 2.5% gradient in resonator frequencies and couplings, altering the mode shapes. The diamond measurements therefore concern a modified array, which the simulations explicitly account for.
Optical spin initialization also heated the superconducting structures. The researchers delayed the microwave interrogation until nearly 20 milliseconds after initialization, allowing recovery. Calling the magnetic measurement non-perturbative applies to that recovered interrogation interval, not to diamond installation or the entire optical sequence.
The preprint demonstrates complementary characterization tools, not a functioning quantum processor or an interacting many-body quantum simulator. All reported measurements used the circuit’s linear-response regime. The practical result is a clearer way to check where microwave fields reside—and whether an apparent imperfection belongs to the circuit or its measurement.
- superconducting resonators
- microwave imaging
- nitrogen-vacancy centers
- laser scanning microscopy
- honeycomb lattice
- edge modes
Reviewed cross-references
These connections were reviewed by a model, not independently fact-checked by a human. Similarity does not imply agreement; consult the original papers and the evidence below.
A superconducting resonator routes strong microwaves without a bias
Shared method: Gaál et al. and MacKay et al. both construct microwave resonators using high-kinetic-inductance superconducting nitride films: the former use NbTiN for a compact LC lattice, while the latter use an NbN meander with current-dependent inductance for nonlinear Fano routing. The shared method is resonator design, not spatial imaging: Gaál et al. keep drive-induced frequency shifts below the linewidth, whereas MacKay et al. require a strong signal to shift the resonance. These preprint excerpts do not establish equivalent performance across the two devices.
Model review: · openai-codex/gpt-6.1-sol
Evidence and provenance
Selected excerpts, not complete papers. PDF extraction can omit figures or damage equations, tables and reading order; sources may be preprints.
2611.13791v1 — Original paper
Excerpt reference:
static/papers/2611.13791v1.md:12-65
Basis: Paper text
Source SHA-256:d7bdbb0f114e5dfd4f0cbcef78515c435db64865463f8448ec89e64f70a74e5e2611.13791v1 — Original paper
Excerpt reference:
static/papers/2611.13791v1.md:147-208
Basis: Paper text
Source SHA-256:d7bdbb0f114e5dfd4f0cbcef78515c435db64865463f8448ec89e64f70a74e5e2611.10915v1 — Original paper
Excerpt reference:
static/papers/2611.10915v1.md:56-177
Basis: Paper text
Source SHA-256:ee7b4996c2d1860685e7741ca7a41b0ded7d8847f7c5e989fe013f960c2b722f