TRANSMISSION // 2611.13181v1
Infrared echoes trace dust around lower-mass black holes
Source published
A preprint measures delayed infrared responses in 65 active galactic nuclei, extending the relationship between dust-region size and luminosity toward fainter systems. The results support temperature-layered dust, while leaving the causes of departures from a simple heating model unresolved.
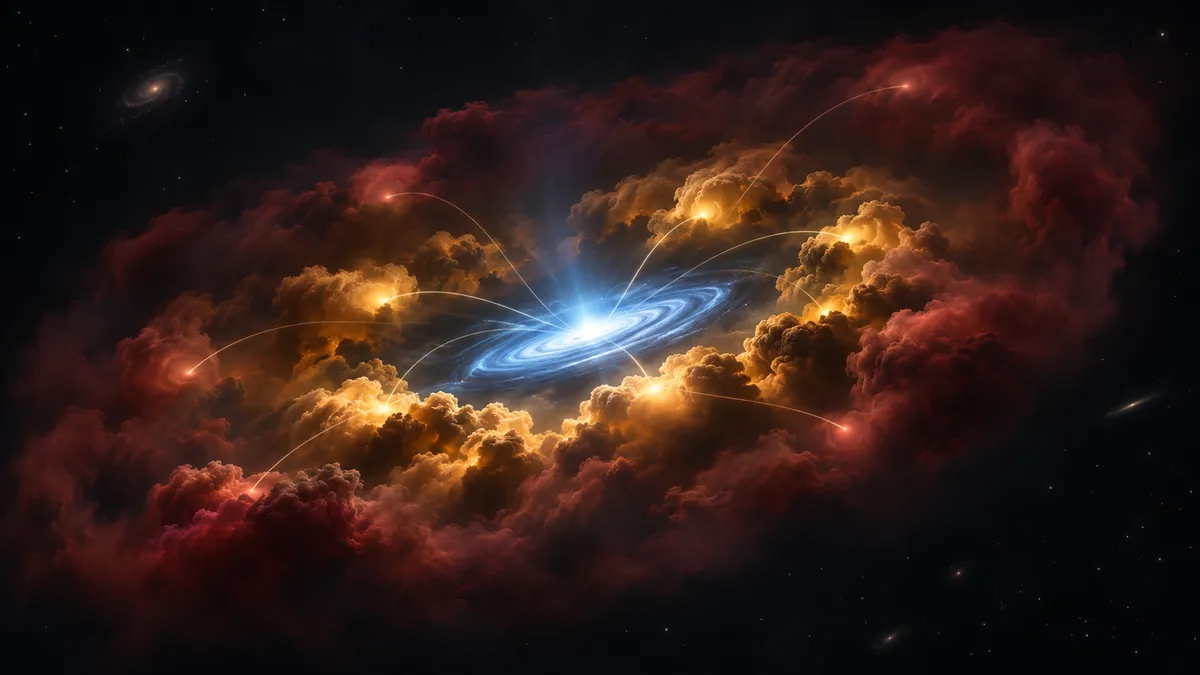
How can astronomers measure dusty structures too small to see directly? They compare a galactic nucleus’s changing optical brightness with the infrared glow that follows, using the delay to estimate where the responding dust lies.
The dusty surroundings of an actively feeding black hole absorb radiation from its accretion disk and emit that energy in the infrared. When the central source brightens or fades, the dust’s infrared response follows later. That delay offers a way to estimate the structure’s size without resolving it in an image.
In an arXiv preprint submitted on November 9, 2026, Chi-Zhuo Wang and colleagues apply this technique, called dust reverberation mapping, to 65 active galactic nuclei. Most host black holes with estimated masses of roughly one million to ten million Suns. Their results extend measurements toward lower-luminosity systems, where weak nuclear emission and light from the surrounding galaxy make the task harder. The findings should be treated as preprint results.
Measuring a delayed response
The researchers began with a literature-compiled catalog of 1,447 candidate intermediate-mass black holes. Uniformly revised mass estimates place most objects in the final sample above about one million solar masses; this is not primarily a survey of the very smallest black holes.
They paired optical observations from the Zwicky Transient Facility, covering 2018–2024, with infrared measurements from WISE and NEOWISE. The infrared observations use two bands: W1 at 3.4 micrometers and W2 at 4.6 micrometers.
After sampling requirements, 1,033 sources remained. Further cuts required strong optical–infrared correlations, tests against unrelated simulated variability, and positive delays from three analysis methods in both infrared bands. These steps produced the 65-source core sample.
The main method, an interpolated cross-correlation, shifts the brightness records relative to one another to find matching variations. Two modeling approaches, JAVELIN and PYROA, provided checks using different treatments of variability. Their lag estimates generally agreed, although they analyze the same underlying observations rather than independent datasets.
The team also corrected for redshift effects and estimated infrared emission coming directly from the accretion disk, rather than dust. Removing this contamination generally increased the inferred delays, especially in W1.
Multiplying a delay by the speed of light gives a characteristic dust radius. This is an effective distance weighted toward dust that responds to brightness changes, not a direct picture of a sharply bounded ring.
Cooler dust responds later
W2 responses generally arrived later than W1 responses. The median W2-to-W1 delay ratio was 1.24: a typical W2 delay was about 24 percent longer. The distribution’s 16th and 84th percentiles were approximately 1.03 and 1.57, showing considerable variation among sources.
That pattern is consistent with hotter dust contributing more strongly at the shorter wavelength and cooler dust lying farther from the central engine. It supports a temperature-stratified structure, but does not uniquely determine its geometry.
The researchers then examined how dust radius changes with luminosity. A simple heating model predicts that radius should scale with the square root of the luminosity heating the dust. Under otherwise unchanged conditions, four times the heating luminosity would mean twice the radius.
For the low-mass sample alone, fitted exponents were 0.43 ± 0.07 in W1 and 0.46 ± 0.06 in W2 when using estimated bolometric luminosity, a measure of total radiative output. Both remain compatible with the square-root exponent of 0.5 within their uncertainties.
Combining these measurements with a previously published, higher-luminosity sample extended the relation across nearly seven orders of magnitude in bolometric luminosity. The combined exponents were 0.47 ± 0.01 and 0.44 ± 0.01: closer to, but still below, the simple prediction.
Why the simple rule may fall short
One possibility concerns illumination. In the combined sample, sources with higher Eddington ratios tended to have shorter delays than predicted from luminosity. The Eddington ratio compares estimated luminosity with a mass-dependent reference luminosity associated with radiation pressure balancing gravity.
A thick inner accretion disk could partly shadow the dust, reducing its heating. However, the observed correlations are weak, and the low-mass sample alone shows no statistically significant relationship. The results do not establish shadowing as the cause.
Another possibility is that the luminosity estimates do not accurately represent the radiation heating the dust. Composite SPHEREx spectra change systematically with luminosity. Contributions from host-galaxy stars also complicate interpretation, especially in faint nuclei.
Sampling remains a constraint
The infrared records were binned into 180-day intervals, making short delays challenging to constrain. Seasonal gaps, interpolation and competing lag solutions remain limitations. Selecting only sources with strong correlations and positive delays also means the sample does not represent every faint active nucleus.
One source associated with the possible tidal disruption flare AT2019dqv had unusually long delays. Its adopted luminosity came from a spectrum taken about 17 years before the flare, illustrating how mismatched observing epochs can complicate interpretation.
The study extends an existing measurement technique into fainter systems. Denser monitoring will be needed to test shorter delays and distinguish changes in dust geometry from changes in illumination.
- astrophysics
- active galactic nuclei
- low-mass black holes
- dust reverberation mapping
- infrared astronomy
- WISE
- Zwicky Transient Facility
Related reading
Automatically matched by shared topic keywords. These links do not imply that the sources agree or establish a consensus.
Young stars hint at feedback-driven formation between two glowing gas regions
Source published
Shared keywords: infrared astronomy
Molecular Gas Reveals a Hidden Nucleus Shining Unevenly
Source published
Shared keywords: active galactic nuclei, infrared astronomy
Cleaner SPHEREx maps reveal interstellar dust chemistry
Source published
Shared keywords: infrared astronomy
JWST finds where a Little Red Dot’s red rise stops
Source published
Shared keywords: infrared astronomy
Old sky surveys add new colours to pulsar companions
Source published
Shared keywords: infrared astronomy