TRANSMISSION // 2611.12117v1
Percentage fare discounts may matter most for cheaper public transport trips
Source published
A randomised Swiss survey found no overall effect of fare presentation on price sensitivity, but percentage labels made respondents more price-sensitive on low-fare journeys. The preprint concerns hypothetical choices, not measured changes in actual travel.
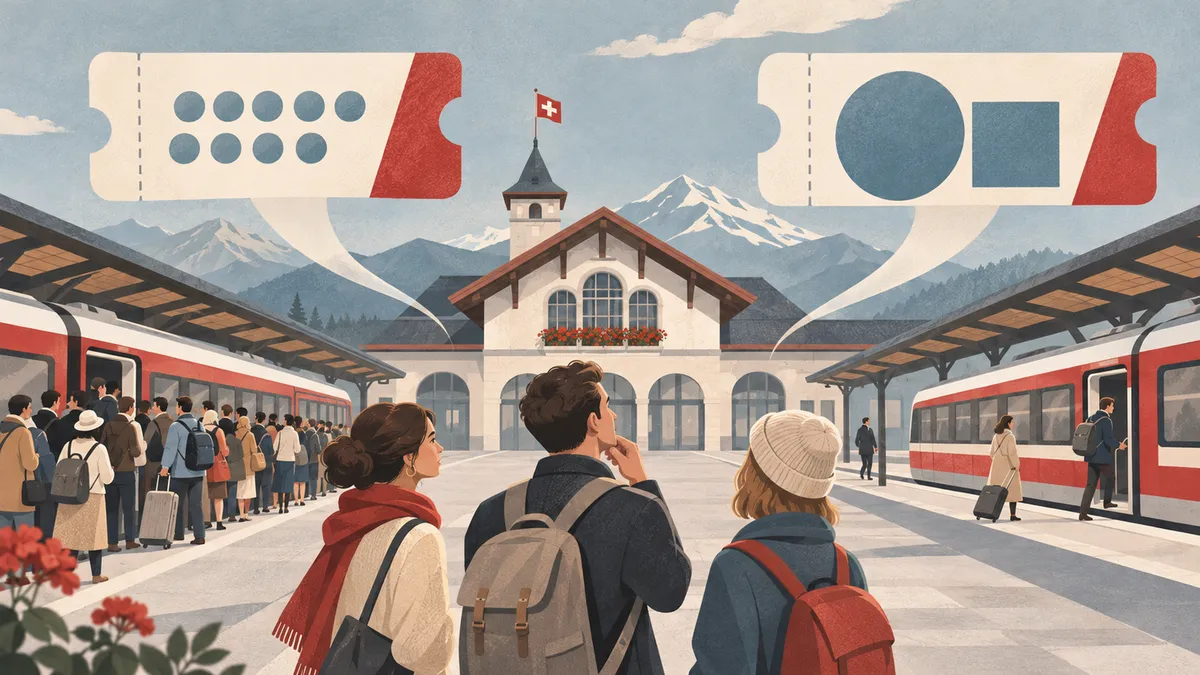
Would passengers respond differently to a cheaper departure if its fare were shown in francs, as money saved, or as a percentage discount? A Swiss experiment suggests the answer depends on the original fare and the gap between the available prices—not simply on how the discount is labelled.
Crowded public transport puts pressure on infrastructure and reduces passenger comfort. Off-peak discounts aim to spread demand by encouraging people to travel at different times. But operators also face a communication choice: should they display the ticket price, the amount saved, or the percentage reduction?
Hannes Wallimann, Silvio Sticher and Christian Weibel, of the Lucerne University of Applied Sciences and Arts, investigated that question in a randomised survey. Their study was posted on arXiv on 9 November 2026 as a preprint; the supplied record does not establish peer-reviewed publication.
Three ways to show the same fare
The final sample contained 1,082 participants from Switzerland’s myRIDE field test, a smartphone-based public transport tariff system. Each respondent completed eight hypothetical choice tasks built around journeys drawn from their own recent travel history.
For each task, participants saw their actual journey as a reference and chose between two hypothetical alternatives, or said they would not have travelled by public transport if those were the only options. Alternatives varied in departure time, duration, sequence of transport modes and fare. Departure times could shift by up to two hours, while prices and journey durations ranged from half to twice their actual values.
Participants were randomly assigned to one of three fare displays. About half saw the full price in Swiss francs. The other groups saw either a monetary difference from their actual fare, such as “CHF 3.50 cheaper”, or a percentage difference, such as “20% cheaper”. The presentation of other journey attributes was unchanged across groups.
This tests price framing: whether expressing a price differently changes its influence on a decision. The actual fare supplied a reference point—the benchmark against which a new price could be judged.
The researchers fitted a multinomial logit model, a statistical method for relating choices among alternatives to their attributes. They tested whether the relationship between price and choice differed across display formats, allowing for repeated answers from each participant.
No overall advantage, but differences for cheaper trips
Across the sample as a whole, neither monetary nor percentage differences produced a statistically significant change in price sensitivity compared with displaying full fares. Price sensitivity here means how strongly price influenced respondents’ hypothetical selections. The overall result therefore did not support the prediction that explicitly showing savings would generally make price more influential.
The pattern changed when the researchers separated trips by fare level. “Low fare” meant an actual reference fare at or below the sample median of CHF 11.93. Respondents were more price-sensitive on these cheaper trips under all formats, with an additional, statistically significant increase when prices appeared as percentages. For higher-fare trips, the format difference was not significant.
That finding is consistent with the idea that a percentage can make a small monetary difference more noticeable. It does not establish the psychological mechanism behind respondents’ choices.
The size of the gap between alternatives also mattered. The researchers measured this spread as the difference between the two fares divided by their average. Percentage presentation was associated with greater price sensitivity at smaller spreads, but lower sensitivity at larger spreads relative to the other formats.
The authors report a modelled crossover corresponding to a discount of approximately 47%. This is a result from their experimental analysis, not an established universal boundary for fare advertising.
What the experiment can—and cannot—show
The main findings remained similar after excluding 122 respondents who always selected the same option across all eight tasks. A separate check found no statistically significant difference between percentage and full-price groups in how opting out varied with the price spread.
Nevertheless, the experiment measured stated preferences, not ticket purchases or observed departure changes. Random assignment supports comparisons of the displays within the survey, but it does not demonstrate that percentage labels would reduce real-world crowding.
Participants had also volunteered for a technology-based fare trial. The authors suggest they may be more technologically confident and frequent public transport users than the wider population. Some experimentally generated fares may have seemed implausible, and applicability to other transport systems remains uncertain.
The practical implication is conditional: percentage labels may strengthen responses to off-peak discounts, particularly for cheaper tickets and smaller discounts. Testing actual booking and travel behaviour would be needed to establish whether that potential translates into passengers changing departure times.
- public transport
- fare communication
- price framing
- off-peak discounts
- stated preferences
- randomised experiment
- Switzerland
Related reading
Automatically matched by shared topic keywords. These links do not imply that the sources agree or establish a consensus.