TRANSMISSION // 2611.10876v1
Webb traces free-floating carbon cages around Tc 1
Source published
JWST spectra reveal gas-phase C60 and C70 molecules concentrated in a thin shell around the planetary nebula Tc 1. Their infrared fingerprints sharpen estimates of fullerene abundance, but overlapping emission bands leave questions about how the molecules glow and where they formed.
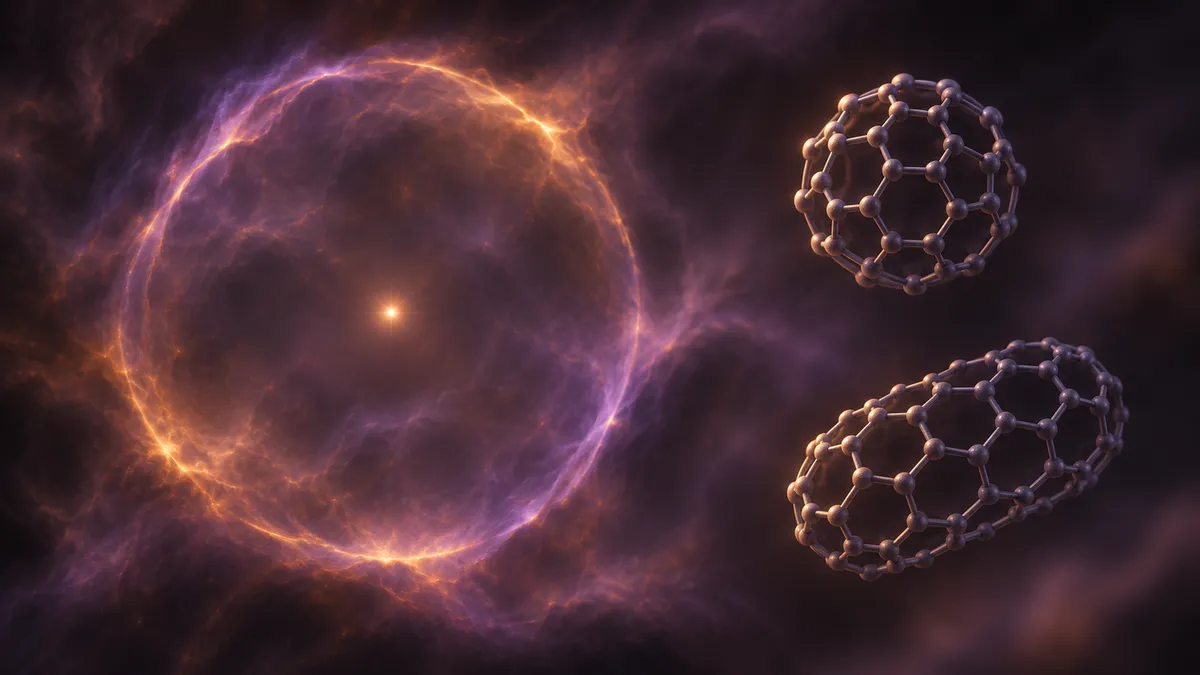
A bright ring of carbon molecules need not mark the place where they were made. Webb observations of Tc 1 reveal fullerene cages both in a prominent shell and beyond it, offering clues to their survival while complicating the story of their origin.
What makes the carbon cages glow?
Tc 1 contains an unusually clear collection of fullerenes: hollow molecules whose carbon atoms form closed cages. Two varieties dominate its fullerene spectrum, C60 and C70, containing 60 and 70 carbon atoms respectively. Their infrared emission gives astronomers a way to study particular large molecules rather than an unresolved mixture of carbon compounds.
Morgan Giese and colleagues used the James Webb Space Telescope to ask where these molecules reside, whether they float freely or cling to dust, and what supplies the energy they radiate. Their study is available as an arXiv preprint; the supplied manuscript also records acceptance on October 16, 2026.
Separating overlapping fingerprints
The team observed Tc 1 on August 8, 2024, using the Mid-Infrared Instrument’s medium-resolution spectrometer. It recorded a spectrum at each position across a three-point mosaic, covering wavelengths from 4.9 to 27.9 micrometres.
Different wavelength channels sample the sky at different scales. To compare emission between channels, the researchers placed the observations on a common, coarser grid and extracted spectra from five selected regions, including the central star, the bright molecular ring and the surrounding halo. For maps of individual features, they retained the original spatial sampling.
They fitted mathematical profiles to the molecular bands, the underlying continuum and narrow atomic emission lines. This matters particularly near 7 micrometres, where an argon line overlaps fullerene emission. Webb can separate those contributions much more cleanly than earlier observations.
The spectra reveal C60’s four main infrared bands and six isolated C70 bands. Additional weak features are tentatively assigned to C60 combination bands, which involve combinations of molecular vibrations. Their wavelengths and spatial distributions support that interpretation, but noise prevents definitive assignments.
Evidence for freely rotating molecules
The strongest physical clue lies within the shapes of the emission bands. The C60 features near 17.4 and 18.9 micrometres contain resolved structure associated with molecular rotation and vibration. Several C70 bands show similar structure.
The authors interpret this as evidence that the emitting fullerenes are in the gas phase, rather than attached to dust grains. It rules out grain-attached thermal emission as the explanation for these bands. Absorption of stellar photons remains the most likely energy source; the nebula’s gas diagnostics also make shock excitation unlikely.
Yet photon-driven emission models do not explain everything. Relative band intensities change across the nebula without simply tracking the weakening radiation field. Processes specific to ionized gas, including interactions with free electrons, may need consideration.
There is another complication: separating atoms from molecules does not separate C60 from C70. C70 contributes to most bands commonly used to measure C60, with the 8.5-micrometre feature least affected. The observed 7.0-to-18.9-micrometre ratio is about 1.4–1.9, compared with roughly 1.3 previously reported, but it cannot be treated as a pure C60 measurement. Disagreement among laboratory and theoretical band strengths makes corrections uncertain.
A shell, not necessarily a birthplace
Both molecules shine most strongly in a thin, asymmetric shell roughly 5–6 arcseconds from the central star. Looking through more emitting material near the shell’s edge makes it appear as a ring. Weaker emission exists inside and outside it, with hints of another shell farther out.
The authors estimate that fullerenes account for about 2.6% of Tc 1’s infrared output, corresponding to approximately 0.6% of its carbon. Those are model-dependent estimates: Webb covered only part of the nebula, requiring extrapolation around it, and the calculation assumes an ultraviolet absorption strength per carbon atom. Unmeasured outer-halo emission is omitted.
The halo is associated with an earlier mass-loss episode than the core, whose ejection dates back at least about 4,000 years. Fullerenes beyond the bright ring therefore argue against treating the ring as their unique formation site. It may instead mark favorable density and excitation conditions.
The researchers speculate that rapid cooling of hot, carbon-rich ejecta produced the cages, possibly during an interaction involving two stars sharing an envelope. That remains a proposed history, not an observed formation event. Searches also found no clear signatures of charged fullerenes or additional cage sizes, although weak, blended contributions cannot be excluded. Webb has clarified the molecules’ physical state more firmly than their birth story.
- Tc 1
- fullerenes
- C60
- C70
- James Webb Space Telescope
- infrared spectroscopy
- planetary nebula
- astrochemistry
Related reading
Automatically matched by shared topic keywords. These links do not imply that the sources agree or establish a consensus.
Webb separates the dust signals around Tc 1’s carbon cages
Source published
Shared keywords: infrared spectroscopy, james webb space telescope, planetary nebula
Webb detects a long-sought rotational signal from a key interstellar ion
Source published
Shared keywords: infrared spectroscopy
Webb catches a molecular ion shedding the energy of its formation
Source published
Shared keywords: james webb space telescope
Ansky’s galaxy shows signs of black-hole activity before its 2019 brightening
Source published
Shared keywords: james webb space telescope
Measuring the stars behind JWST’s planet spectra
Source published
Shared keywords: infrared spectroscopy