TRANSMISSION // 2611.09370v1
Reading starlight without flattening the star
Source published
OpenMULTI3D models how light travels through structured stellar atmospheres. Its tests show why three-dimensional models can change inferred temperatures and chemical abundances—and why faster spectrum calculations still have important limits.
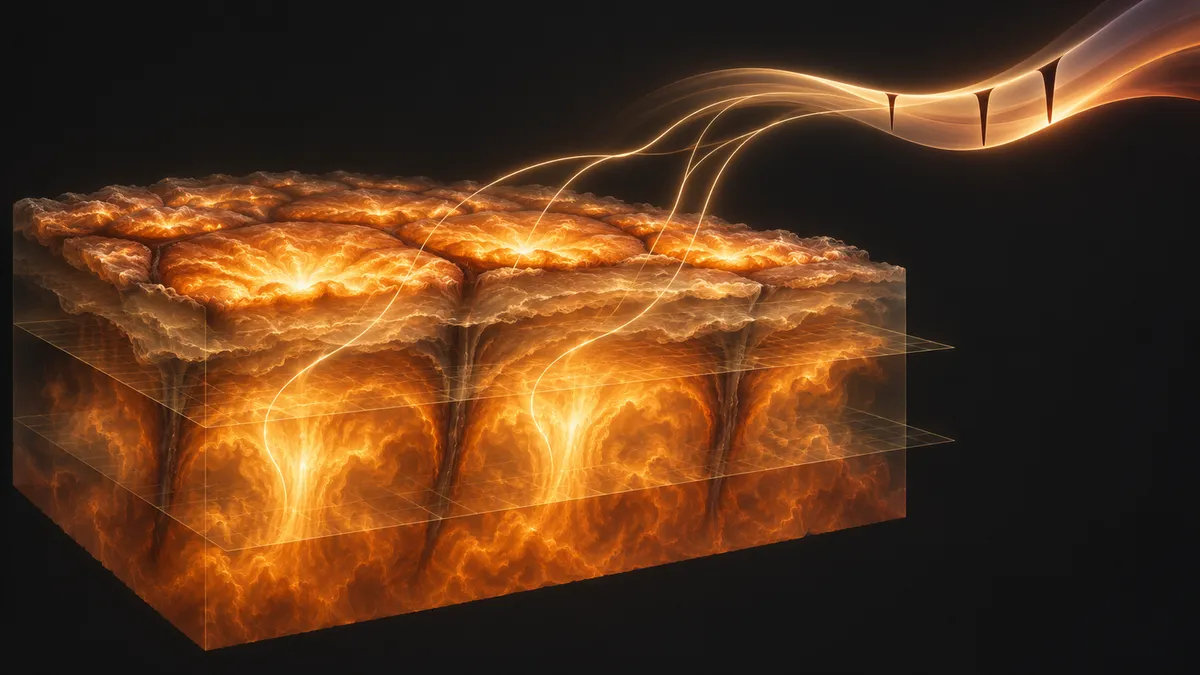
A stellar spectrum carries clues to a star’s temperature, chemistry and moving gas. Interpreting those clues requires a model of how the light formed. OpenMULTI3D makes that calculation available in three dimensions, with tests that expose where simpler assumptions can mislead. The paper has been accepted for publication in Astronomy & Astrophysics.
How much does the model behind a stellar measurement matter? Astronomers infer temperatures and chemical abundances by comparing observed spectra with calculated ones. But a detailed observation does not automatically produce an equally reliable answer: the calculation must represent the atmosphere that shaped the light.
In their paper posted to arXiv, Richard Hoppe and colleagues introduce OpenMULTI3D, publicly available software for calculating spectra from stellar atmosphere models. It succeeds the previously unreleased MULTI3D code. The motivation is practical: surveys including WEAVE, 4MOST and SDSS-V are expected to deliver millions of high-resolution stellar spectra, requiring extensive libraries of synthetic spectra for interpretation.
Two simplifications to move beyond
A one-dimensional atmosphere describes how conditions change with depth, without representing the horizontal pattern of rising and sinking gas. Three-dimensional simulations retain that structure, including differences in temperature, density and velocity across a modelled surface region.
The second distinction concerns local thermodynamic equilibrium, or LTE. Under this assumption, atomic energy-level populations follow the local temperature and density. Non-LTE calculations instead solve for populations using the balance of radiative and collisional transitions, accounting for radiation travelling through the atmosphere. Those populations affect how strongly gas absorbs and emits light.
OpenMULTI3D takes atmosphere models as inputs; it does not generate the underlying stellar convection simulations. It calculates energy-level populations and can then use them to synthesise spectra. Its intended temperature range is approximately 2,500–8,000 kelvin, covering the AFGKM stellar types named in the paper.
Making the calculation manageable
The software runs within the DISPATCH computing framework, which organises work into tasks. It also avoids unnecessary calculations in extremely weak spectral-line wings and can stop updating atmospheric subregions whose populations have already converged.
Another technique addresses an awkward numerical problem: light usually travels at an angle to the simulation grid. Interpolating atmospheric properties along these slanted paths can introduce errors, especially after reducing the grid’s resolution. The authors instead project the original atmosphere onto grids aligned with the light paths before reducing their resolution.
For nine benchmark spectral features in one solar snapshot, this approach reproduced full-resolution line strengths to within 0.5%, using a horizontal grid of 30 by 30 points rather than 240 by 240. Without that projection, some inclined-ray errors reached about 7%. This is a demonstrated improvement for those tests, not a universal accuracy guarantee.
The authors also compared outputs with MULTI, MULTI3D and TurbospectrumNLTE. They report close agreement when physical inputs and settings were matched. For the MULTI3D comparison, they corrected two identified problems in the older code first. Such comparisons establish numerical consistency; they do not independently establish that every atmospheric assumption is correct.
When the inferred star changes
One revealing example concerns hydrogen’s Balmer lines in a model metal-poor red giant with an effective temperature of 5,000 kelvin. The three-dimensional calculations produced stronger line wings than the one-dimensional models.
Crucially, those strong wings appeared both with and without non-LTE treatment. Here, the main cause was the three-dimensional atmospheric structure, not the departure from LTE. At a selected distance from each line’s centre, matching the three-dimensional wings with one-dimensional models required temperatures roughly 340–450 kelvin higher. The inferred offset depends on the line and fitting method; it is not a correction to apply indiscriminately to red giants.
For three magnesium lines in a different, metal-poor model, three-dimensional non-LTE abundance corrections relative to one-dimensional LTE ranged from +0.02 to +0.17 dex. These logarithmic corrections describe changes in the abundance inferred from a spectral feature, not changes in the star’s actual composition.
Motion, cost and remaining limits
Sequences of about 100 atmospheric snapshots also produced changing magnesium-line profiles. Line-core intensity fluctuations peaked around 35% in the giant model and 7% in the dwarf model. These describe a simulated surface patch viewed face-on—not the variability expected from an unresolved whole star.
The computational cost also varies sharply. A high-resolution one-dimensional optical spectrum took 3.2 seconds on the tested laptop. A three-dimensional optical synthesis took 17 minutes on a 32-CPU node, while calculating three-dimensional non-LTE populations for the large iron model took 10 hours. Spectrum synthesis and population calculations are distinct workloads.
Important approximations remain. The non-LTE populations do not feed back into the supplied atmospheric structure or equation of state. The calculations assume statistical equilibrium within each snapshot, even when snapshots form a time sequence. Reliable analysis also requires correct atomic data and careful matching of spectral lines to energy levels; unmatched lines can remain in LTE.
The advance is therefore a tested, accessible calculation tool—not an automatic guarantee of accurate stellar measurements. Its examples show both why atmospheric detail matters and where users must still scrutinise the physics.
- OpenMULTI3D
- stellar spectra
- radiative transfer
- non-LTE
- stellar atmospheres
- convection
- chemical abundances
Related reading
Automatically matched by shared topic keywords. These links do not imply that the sources agree or establish a consensus.
A new climate model checks the boundaries of the habitable zone
Source published
Shared keywords: radiative transfer
Cluster galaxies show a subtle nitrogen–oxygen abundance offset
Source published
Shared keywords: chemical abundances
New model estimates how aging stars replenish a nearby dwarf galaxy
Source published
Shared keywords: radiative transfer
Three kinds of light trace a massive star reshaping its cloud
Source published
Shared keywords: radiative transfer