TRANSMISSION // 2611.08953v1
Measuring the noise that can hide faint cosmic radio signals
Source published
Tests of a 19-element radio telescope receiver report system noise temperatures of roughly 73–89 kelvin. The preprint separates contributions from electronics, interactions between antennas and the surrounding landscape, while identifying limits caused by interference and overlapping frequency signals.
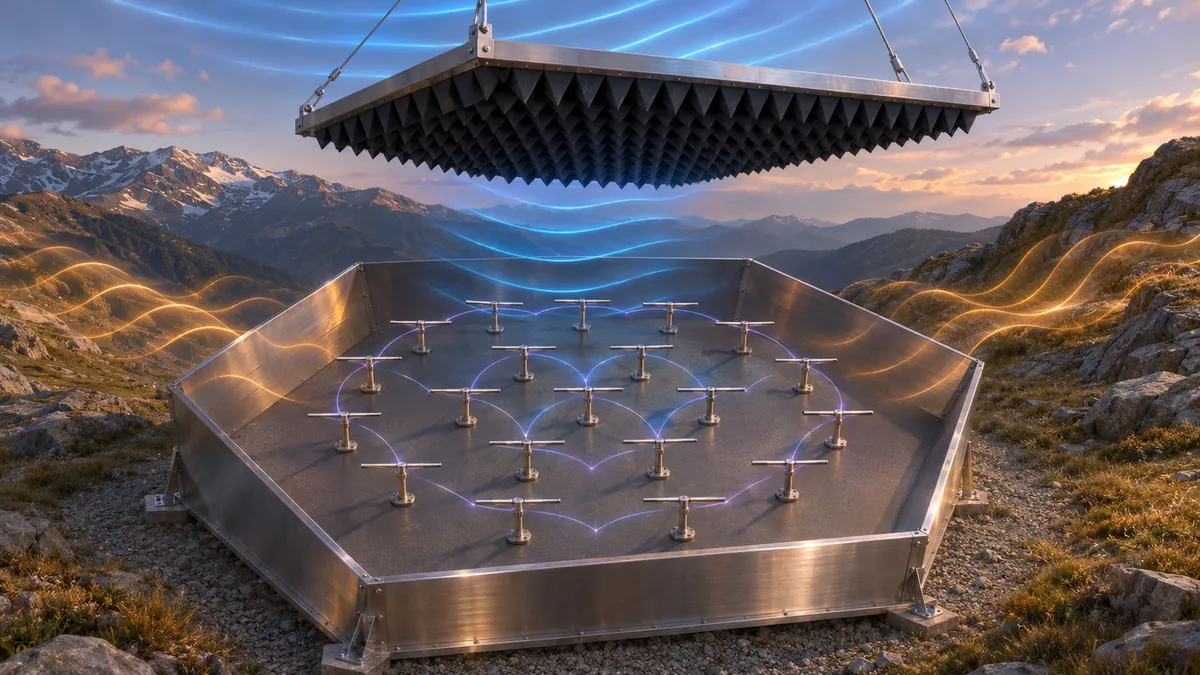
A radio telescope receiver must distinguish faint signals from noise generated both inside its electronics and around it. In a preprint, Shenghua Yu and colleagues investigate that challenge using a 19-element phased array feed. Their measurements show how calibration, amplifier temperature and shielding affect the noise budget—and why identifying the source of that noise is not straightforward.
A receiver with many interacting parts
A phased array feed combines signals from multiple antenna elements electronically, allowing a radio telescope to form several observing beams simultaneously. That can accelerate sky surveys, but closely packed antennas also interact electromagnetically. Signals and noise can pass between elements, complicating the task of measuring the receiver’s performance.
Yu and colleagues tested a room-temperature array of 19 dipole elements arranged in a hexagonal pattern at a mountain-saddle site in Longshan, Hunan, China. Their preprint, whose landing record lists acceptance for publication in Research in Astronomy and Astrophysics, reports observations on four days between March and June 2026.
The central quantity is noise temperature: a way of expressing noise power as an equivalent temperature. It does not mean the equipment is physically that cold. Lower system noise temperature means less background against which astronomical signals must be detected.
Comparing a warm target with the sky
The researchers used a modified version of the Y-factor method. They compared the array’s output while it viewed a warm microwave absorber with its output while it viewed the much colder radio sky. The ratio of those powers, together with the assumed temperatures of the two targets, provides an estimate of receiver noise.
The warm target consisted of sixteen pyramidal foam absorbers assembled into a roughly two-metre-square panel. A detachable stainless-steel screen partially shielded the array from radiation arriving from the ground, surrounding mountains and nearby structures. Separate sky measurements without the screen tested the importance of that environmental pickup.
Each dataset recorded about 10.5 seconds of voltage signals. A Python pipeline removed offsets, aligned channels in time and equalized their amplitudes. It then calculated beamforming weights designed to maximize signal-to-noise ratio, rather than simply adding every channel equally. The final noise spectra had frequency bins approximately 0.60 megahertz wide.
What the measurements found
Within the stated 1.37–1.47 gigahertz operating band, the authors report beam-equivalent system noise temperatures of approximately 73–89 kelvin. These estimates include receiver noise and adopted contributions from the sky and spillover—radiation entering outside the intended main beam.
For one repeated frequency-conversion setting, average system temperatures were about 75, 83, 78 and 86 kelvin across the four observing dates. These are four measurement epochs, not continuous monitoring over the intervening months.
The authors associate part of the variation with equipment temperature and ventilation. A protective enclosure installed after the March observations initially restricted airflow; ventilation was subsequently improved. Manufacturer specifications suggest that warming the first amplifier from 15 to 38 degrees Celsius would add roughly 6 kelvin of noise, about half the approximately 12-kelvin receiver-noise difference discussed in the paper. That supports a thermal contribution without establishing that this amplifier explains the entire drift.
The shielding comparison produced a larger change. On June 10, removing the screen raised the inferred receiver noise temperature from approximately 75 kelvin to more than 142 kelvin. The authors attribute the increase mainly to environmental radiation entering through sidelobes. This is an increase in the measured noise estimate, not evidence that the electronics alone suddenly became noisier.
Extracting the correlated component
To investigate antenna interactions, the team analysed covariance matrices, which describe how signals fluctuate together across channels. Their method uses the weighted off-diagonal terms—correlations between different channels—to estimate a mutual-coupling noise contribution.
The reported baseline is approximately 2–8 kelvin, with some hot-load features exceeding 20 kelvin. Separate estimates based on antenna-to-antenna transmission measurements and simulations place the full-array contribution at roughly 7.6–10.7 kelvin, which the authors regard as broadly consistent with the experimental baseline.
Those correlations nevertheless require interpretation. The paper identifies radio-frequency interference as a possible contributor and suggests that thermal and non-thermal radiation both affect the extracted component. The decomposition should therefore be understood within its stated model, rather than as an independently isolated measurement of antenna coupling under every condition.
Important limits on the result
Some frequency-conversion settings caused signals from different radio frequencies to overlap in the recorded spectrum. The authors show that the hot-to-cold power ratio can remain unchanged in a simplified model, but acknowledge that strong interference can affect it. Those spectra consequently provide only a broader indication of noise performance, not an unambiguous frequency-by-frequency measurement.
The budget also adopts assumptions, including unity radiation efficiency, approximately 10 kelvin of losses before the first amplifier, and 2 kelvin of spillover. Most comparisons use a common assumed hot-load temperature of 288 kelvin despite changing ambient conditions.
The study provides a practical characterization workflow, not a complete explanation of every noise feature. Planned radiation-pattern measurements and hardware changes are intended to clarify the remaining environmental and spectral uncertainties.
- radio astronomy
- phased array feed
- system noise temperature
- Y-factor method
- beamforming
- mutual coupling
- radio-frequency interference
Related reading
Automatically matched by shared topic keywords. These links do not imply that the sources agree or establish a consensus.
Which exoplanets could the SKA hear? A radio forecast with important caveats
Source published
Shared keywords: radio astronomy
Simulations explore how three antennas could locate solar radio signals
Source published
Shared keywords: radio astronomy
Ammonia Maps Offer a Closer Look at Gas Near the Milky Way’s Centre
Source published
Shared keywords: radio astronomy
Radio surveys reveal a faint signal from IX Velorum
Source published
Shared keywords: radio astronomy
Radio galaxies masquerade as tiny gravitational lenses
Source published
Shared keywords: radio astronomy