TRANSMISSION // 2611.08891v1
Three kinds of light trace a massive star reshaping its cloud
Source published
Simulations combine infrared dust emission, radiation from ionized gas and microwaves from spinning nanoparticles to explore how an expanding stellar bubble changes appearance. The results show why observing frequency, viewing direction and the area measured all matter when interpreting a star-forming cloud.
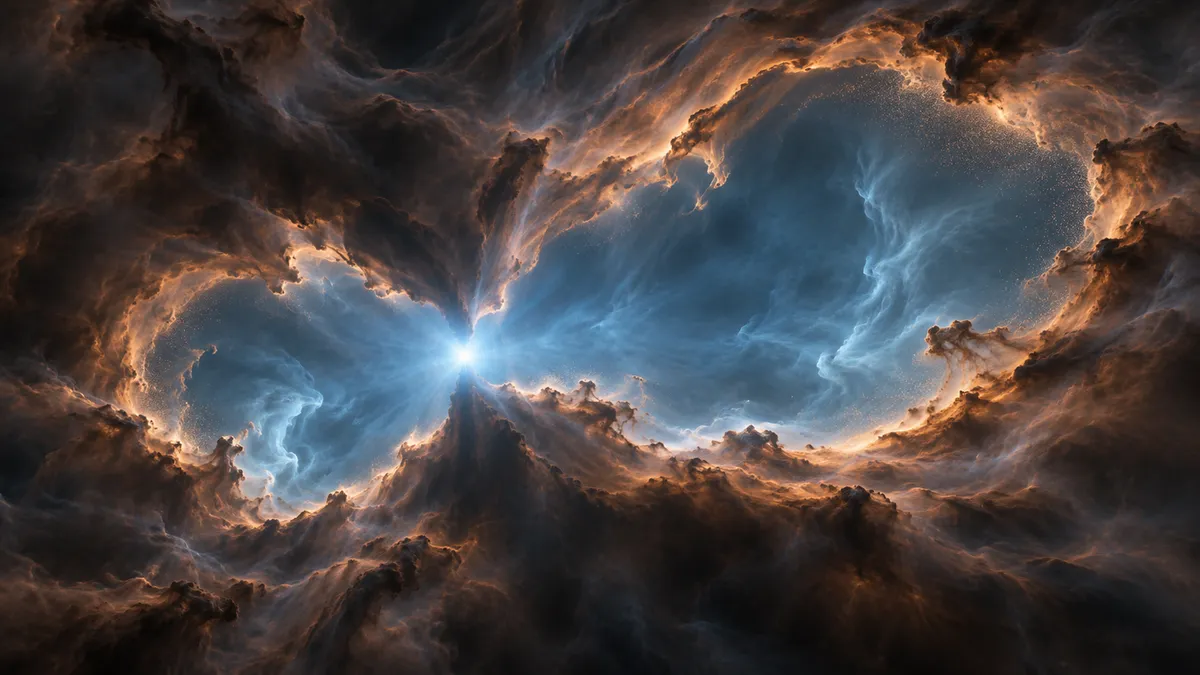
A young massive star changes more than its surroundings: it changes how those surroundings shine. A modeling study follows three overlapping sources of light to investigate what astronomers can—and cannot—learn from an expanding region of ionized hydrogen.
What does a massive star do to the cloud that formed it? Astronomers can look for heated dust and gas stripped of electrons by stellar radiation. But these ingredients emit overlapping signals, and their apparent relationship changes with the size of the structures being examined.
In an arXiv manuscript posted on November 6, 2026, Stefan Reissl and colleagues calculate how three sources of emission would appear during the expansion of an H II region: a volume of hydrogen ionized by a young massive star. Their results are synthetic observations of a simulated cloud, not a newly observed astronomical object.
Building a cloud’s spectrum
The team starts with a three-dimensional RAMSES simulation of a molecular cloud containing 10,000 times the Sun’s mass. It includes gravity, turbulence, magnetic fields, protostellar jets and ionizing radiation. The setup produces one ionizing star with a mass of about 20 Suns, alongside a population of other stars.
Six selected snapshots span configurations from an ultracompact ionized region with a radius of 0.06 parsecs to an extended region nearly five parsecs in radius. A parsec is about 3.26 light-years. The researchers then use the POLARIS radiation-transfer code to calculate how radiation travels through each snapshot and what emission emerges between 1 and 10,000 gigahertz.
The three components have different physical origins. Thermal dust emission comes from grains heated by radiation. Free-free emission is produced as free electrons accelerate in the electric fields of ions. Anomalous microwave emission, or AME, is modeled here as radiation from rapidly rotating nanoparticles with electric dipole moments—an uneven distribution of electric charge.
For those particles, the authors adopt composite “Astrodust” grains containing silicate and carbonaceous material. This is a modeling choice, not a demonstration that these grains uniquely explain astronomical AME.
Expansion changes what escapes
Early in the sequence, the ionized region is dense and compact. At low radio frequencies, its own gas absorbs radiation strongly enough that material deeper inside is obscured. At higher frequencies, more of the radiation escapes. This produces a turnover between a steeply rising free-free spectrum and a nearly flat, gently declining spectrum.
As the region expands and becomes more tenuous, the simulated free-free emission becomes transparent across the studied frequency range. Its appearance also becomes less dependent on viewing direction. In the compact stage, different sightlines cross different concentrations of absorbing gas, so a simple uniform-cloud spectrum does not fully describe the result.
Dust tells a complementary story. When measurements include only the small region around the embedded ionizing star, relatively hot dust dominates. As the measurement area grows with the ionized region, it includes more cool material, shifting the thermal peak toward the far-infrared. Measuring the wider cloud instead mixes temperatures and broadens the spectrum. The apparent evolution therefore reflects both physical changes and which material is included.
AME also depends on that choice. The detailed results report an early peak near 37 gigahertz and a late peak near 26 gigahertz, with lower peaks in intermediate snapshots. Numerical descriptions differ elsewhere in the manuscript, so these values should not be treated as a single precise evolutionary sequence. Including the wider environment introduces a secondary, lower-frequency component from more diffuse material.
Dust grains can break apart
The calculations include several ways to destroy grains: heating, impacts by gas particles, electrostatic stress and rotation fast enough for centrifugal stress to break them apart.
Rotational disruption has the largest effect on the predicted spectra under the modeled conditions. Early on, surrounding material absorbs stellar ultraviolet light and re-emits it in the infrared, limiting the radiative torques that spin up larger grains. Later, radiation travels farther through the cleared cavity, making disruption more effective.
Breaking larger grains supplies smaller fragments and can strengthen AME. Disrupting the fastest-spinning nanoparticles also suppresses its high-frequency tail. Changing the assumed grain strength alters microwave emission more strongly than the overall thermal dust signal.
Complementary tracers, conditional predictions
A scale-by-scale comparison finds that hot-dust structures remain positively associated with total gas column density—the amount of gas along a sightline. Free-free structures instead align strongly with electron column density on large scales. That is a spatial association, not a direct proportionality: free-free emission depends on electron density squared, integrated along the sightline.
Important uncertainties remain. Dust is added after the dynamical simulation, without its full intervening history. Grain strength and fragment sizes are uncertain, and the disruption prescription assumes maximal disruption of susceptible large grains. Instrumental resolution, noise and other observing effects are not included. This account uses the supplied PDF text extraction; equations and figures may not be reproduced reliably.
The practical lesson is that no single brightness map measures every ingredient. Combining frequencies can help distinguish cold material, ionized gas and small-grain physics—but only with attention to geometry, measurement area and model assumptions.
- massive star formation
- H II regions
- thermal dust emission
- free-free emission
- anomalous microwave emission
- spinning dust
- radiative transfer
- POLARIS
Related reading
Automatically matched by shared topic keywords. These links do not imply that the sources agree or establish a consensus.
Molecular outflows offer clues to how massive young stars gather gas
Source published
Shared keywords: massive star formation
Reading starlight without flattening the star
Source published
Shared keywords: radiative transfer
A new climate model checks the boundaries of the habitable zone
Source published
Shared keywords: radiative transfer
New model estimates how aging stars replenish a nearby dwarf galaxy
Source published
Shared keywords: radiative transfer