TRANSMISSION // 2611.08633v1
Two telescopes tracked fourfold quasars to measure light and gravity
Source published
Six months of observations let researchers estimate the size of one quasar’s emitting region and constrain light-travel delays in another, though important modelling assumptions and a conflicting earlier measurement remain.
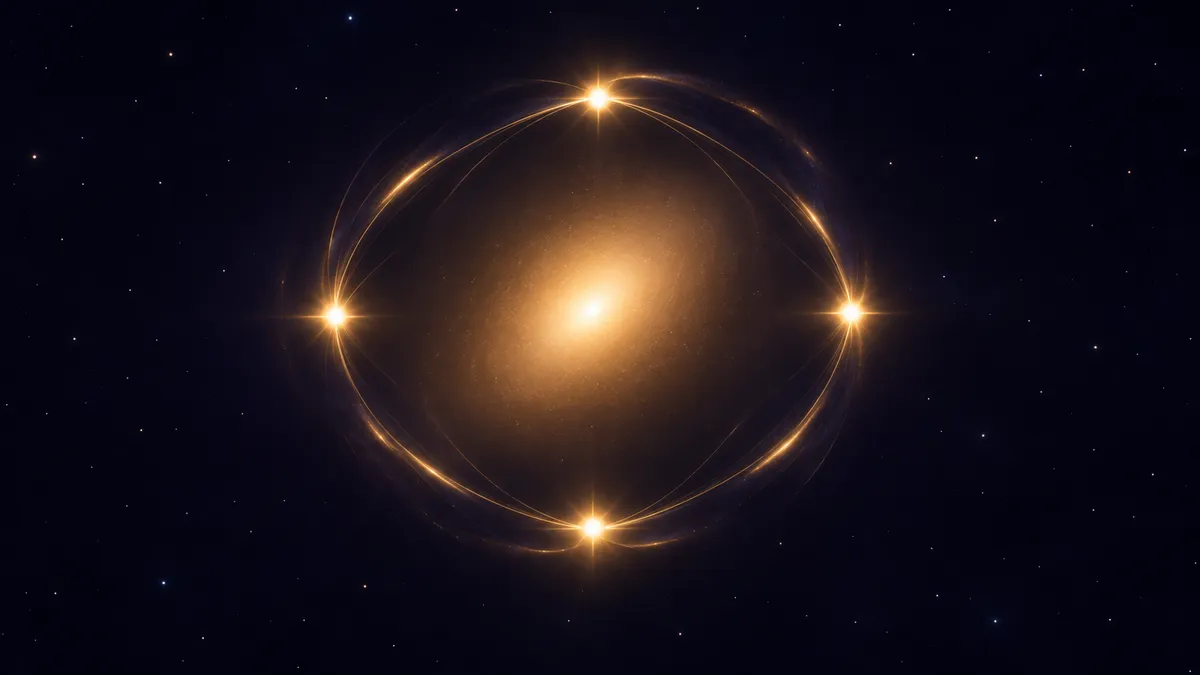
A foreground galaxy can split the light of a distant quasar into four images. By watching those images brighten and fade, astronomers can investigate both the quasar and the matter bending its light.
Four views of one distant source
A quasar is a brilliant source powered by matter falling toward a supermassive black hole. When a galaxy lies between a quasar and Earth, its gravity can bend the quasar’s light along different paths. In some alignments, observers see four images of the same source.
Those images are not identical copies in time. Light takes different routes through the foreground galaxy’s gravitational field, so a change in the quasar can appear in one image before another. Individual stars in the foreground galaxy can also magnify the images differently, producing additional brightness changes known as microlensing.
In a preprint, L. J. Goicoechea and colleagues report a roughly six-month monitoring campaign designed to see what relatively short observations can reveal. Between July 2025 and January 2026, they used the Liverpool Telescope and TTT3, two robotic, two-metre-class telescopes, to observe two four-image systems in green and red optical bands.
A quasar measured through stellar lenses
The first target, QSO 2237+0305, is known as the Einstein Cross. Its four images surround the bright centre of a foreground spiral galaxy. Separating their light required a model of both the galaxy and the blurred appearance of point sources in each usable image.
The researchers focused on the green-band brightness records of images A and B. The delays between Einstein Cross images are thought to be only hours long, much shorter than the usual spacing between these observations. Subtracting one image’s brightness record from the other therefore largely removes changes originating in the quasar itself, leaving a signal dominated by differences in microlensing.
That signal varied over roughly 150 days. To interpret it, the team simulated how a source of a given size would move across magnification patterns produced by stars, then compared simulated brightness differences with the observed curve. Larger and smaller emitting regions smooth those patterns differently.
Under their model assumptions, the authors estimated a green-band half-light radius of 3.5 to 16 light-days at the one-sigma level. A light-day is the distance light travels in a day; the half-light radius encloses half the modelled source’s light. This is an estimate of the emitting region’s size, not a direct image of its boundary.
The result depends on assumptions about the lensing stars, their average mass, the source’s brightness profile and the effective motion across the magnification pattern. The authors say it agrees with an earlier estimate based on much longer monitoring.
Timing the Andromeda Parachute
The second target, PS J0147+4630, is called the Andromeda Parachute. Its three brightest images form a compact arc, while a fourth lies farther away. The team modelled the overlapping images and lens galaxy to extract their brightness, and corrected some TTT3 frames for contamination from the diffraction spike of a saturated nearby star.
The researchers compared the red-band brightness histories of the three arc images, shifting pairs in time to find how well their variations matched. Their method allowed a slowly changing microlensing contribution, represented by a linear trend. Simulated light curves supplied uncertainty estimates.
For the delay between images A and B, they found 0.0 days, with a two-sigma uncertainty of 1.9 days. For A and C, they found 0.2 days, with a two-sigma uncertainty of 1.8 days. Both intervals include zero, so they do not establish which image leads the other. The new A–C interval also conflicts with an earlier reported two-sigma interval; the authors discuss possible explanations but do not resolve the discrepancy.
The team used the new delays and Hubble Space Telescope image positions to explore a model of the foreground mass distribution. That model favoured a somewhat shallower mass profile than an isothermal one, a standard comparison profile. A separate model using image positions and prior assumptions produced a similar preference. These are model-dependent interpretations, not a direct map of all matter along the line of sight.
What a short campaign can—and cannot—show
TTT3 observations over several January nights found no evidence of hourly or faster optical changes of at least 0.010 magnitude in the three bright Parachute images. Such rapid variations might have helped refine the delays; the authors instead call for denser monitoring to determine their ordering more accurately.
The study offers two case studies rather than a guarantee that every four-image quasar will yield equally useful measurements. It also demonstrates precision monitoring with TTT3 during its commissioning phase. For the Einstein Cross, the short campaign constrained an emitting-region size through microlensing; for the Parachute, it narrowed short time delays while leaving a discrepancy and important questions for further observation.
- gravitational lensing
- quasars
- microlensing
- time delays
- Einstein Cross
- Andromeda Parachute
Related reading
Automatically matched by shared topic keywords. These links do not imply that the sources agree or establish a consensus.
Double gravitational lenses offer a new handle on hidden galaxy mass
Source published
Shared keywords: gravitational lensing
JWST finds where a Little Red Dot’s red rise stops
Source published
Shared keywords: gravitational lensing
Can geometry help astronomers find gravitational arcs?
Source published
Shared keywords: gravitational lensing
Can brightness gradients reveal subtle distortions in distant galaxies?
Source published
Shared keywords: gravitational lensing
VENUS maps 60 galaxy clusters that magnify the distant universe
Source published
Shared keywords: gravitational lensing