TRANSMISSION // 2611.07373v1
Galaxy Images Offer Clues to Billions of Years of Star Formation
Source published
A preprint introduces Katachi-PRIME, a machine-learning method that combines galaxy images with brightness measurements to estimate physical properties and past star formation. It improves agreement with reference estimates compared with five-band optical photometry, but its apparent historical reach depends on galaxy population, color information and the assumptions behind its training labels.
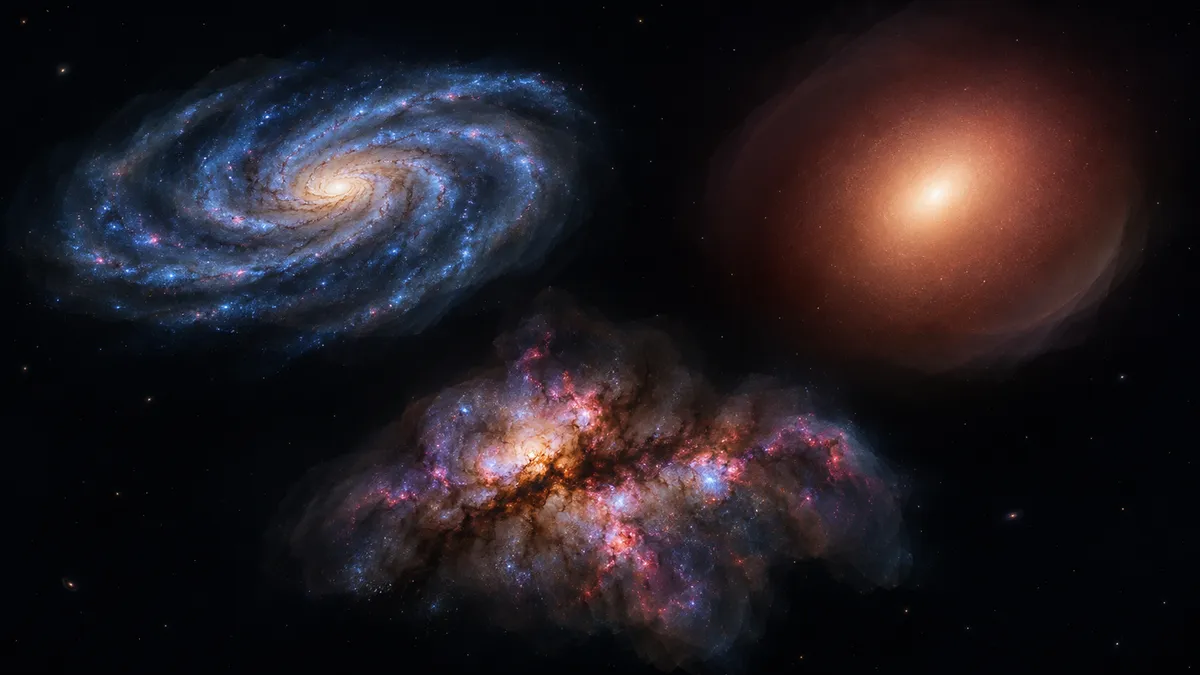
A galaxy’s appearance may preserve clues to its past, but reading that record is not straightforward. Researchers have developed a method that uses both images and brightness measurements to reconstruct model-based star-formation histories—and investigate where those reconstructions become unreliable.
More than total brightness
Astronomers often estimate a galaxy’s properties by comparing its light across different wavelengths with theoretical models. This approach, called spectral energy distribution fitting, can constrain stellar mass, dust content and star formation. But limited wavelength coverage leaves ambiguities: a young, dusty galaxy can resemble an older one.
In a preprint submitted to The Astrophysical Journal, Juan Pablo Alfonzo and colleagues introduce Katachi-PRIME. The method supplements brightness measurements with information from galaxy images, seeking clues that disappear when a galaxy’s light is reduced to a few integrated measurements.
The study reports improved predictions relative to a model using five optical bands. It also investigates how far into the past present-day images can reproduce reference star-formation histories. These are model-dependent reconstructions, not direct observations of ancient activity.
Learning from nearby galaxies
The team selected 232,343 galaxies from the GALEX-SDSS-WISE Legacy Catalog, spanning redshifts between 0.02 and 0.16. Their data combine ultraviolet, optical and infrared observations with three-color optical images.
A vision transformer—a neural network that learns relationships between image patches—converted each image into a numerical representation. Another machine-learning component used these representations, brightness measurements or both to estimate probability distributions rather than single answers.
The targets included stellar mass, star formation per unit stellar mass, redshift, the time associated with forming half the stellar mass, dust attenuation and gas-phase metallicity, represented by oxygen abundance. An additional analysis predicted star-formation histories.
Crucially, the reference properties came from earlier seven-band SED fitting. The historical targets were reconstructed with the Dense Basis method using those fitted properties and formation-time estimates. They therefore carry assumptions and uncertainties inherited from the reference modeling.
The researchers reserved 20% of the sample for testing. Most reported population results use training and test galaxies together, although the authors state that the same trends appear in the test set alone.
Where images improved estimates
Combining images with five-band optical photometry reduced prediction scatter for all six properties compared with either input alone. For logarithmic stellar mass, the reported scatter fell from 0.257 dex with five-band photometry to 0.145 dex with combined inputs. Dex expresses differences on a base-10 logarithmic scale.
The improvement was not equally large for every property: scatter in the half-mass formation-time estimate changed from 0.940 to 0.897 billion years. The image-based model also reduced correlations among uncertainties in age, dust and metallicity, indicating less ambiguity within its inferred distributions.
However, images added much less when the model already had 11-band ultraviolet-to-infrared photometry. Those bands include all seven used to generate the training labels, making them particularly informative for reproducing those labels. The results do not establish that images generally replace broad wavelength coverage.
Defining a galaxy’s “memory”
The authors defined “continuous memory” as the uninterrupted sequence of sampled past times for which the reference star-formation rate remained inside the model’s 16th-to-84th-percentile prediction interval. This is an uncertainty-based criterion, not proof of an exact reconstruction.
Under that definition, ordinary star-forming, or main-sequence, galaxies showed continuous memories of roughly four to seven billion years. Quiescent galaxies, with little ongoing star formation, showed about three to five billion years.
Starburst galaxies had much shorter continuous memories, approximately zero to 0.8 billion years. Green-valley galaxies, occupying an intermediate range of star-formation activity, showed around two to four billion years.
A separate “robust memory” measure required agreement at a past time and its neighboring sampled times, but allowed failures elsewhere. This recovered older intervals even for populations with short continuous memories. Consequently, failure to reconstruct the recent past did not imply that all older information was lost.
Interpretations, not established causes
The authors discuss disturbed structures and delays between changing star formation and changing morphology as possible explanations. A simplified toy model with delayed structural response reproduced the population trends better than an instantaneous-response model across all groups. That comparison supports an interpretation; it does not establish individual galaxies’ physical histories.
Color also matters substantially. Single-band images performed worse than three-color images, while reducing image resolution produced smaller effects. The predictive information cannot therefore be attributed to shape alone.
Limits before wider deployment
The paper identifies a central risk: networks may exploit apparent size, brightness or population correlations specific to the nearby training sample rather than transferable structural clues. Performance on more distant, less-resolved galaxies remains unestablished.
The authors propose validation using realistically modeled simulated observations with known histories. Applications to Euclid, Roman and Rubin surveys remain prospects, requiring representative training data. For now, Katachi-PRIME demonstrates improved recovery of SED-derived estimates—not independently verified galaxy histories.
- galaxy morphology
- star formation history
- Katachi-PRIME
- spectral energy distribution
- machine learning
- vision transformers
- galaxy evolution
Related reading
Automatically matched by shared topic keywords. These links do not imply that the sources agree or establish a consensus.
Machine learning connects atomic physics to simulations of stellar winds
Source published
Shared keywords: machine learning
Teaching vision transformers where finer image patches matter
Source published
Shared keywords: vision transformers
How JWST Could Trace the Seeds of the First Massive Black Holes
Source published
Shared keywords: galaxy evolution
Euclid forecast points to millions of galaxy spectra, with oxygen-line counts less certain
Source published
Shared keywords: galaxy evolution
Galactic Light Echoes Reveal Candidates for Fading Black Hole Activity
Source published
Shared keywords: galaxy evolution