TRANSMISSION // 2611.07161v1
Rubin camera data reveal atmospheric shifts that carry clues to galaxy redshifts
Source published
Researchers report detecting wavelength-dependent shifts in the apparent positions of galaxies and quasars in Rubin Observatory commissioning data. The shifts contain information beyond ordinary broadband colours and could help distinguish objects at different redshifts, although the study does not measure an improvement in redshift-estimation accuracy.
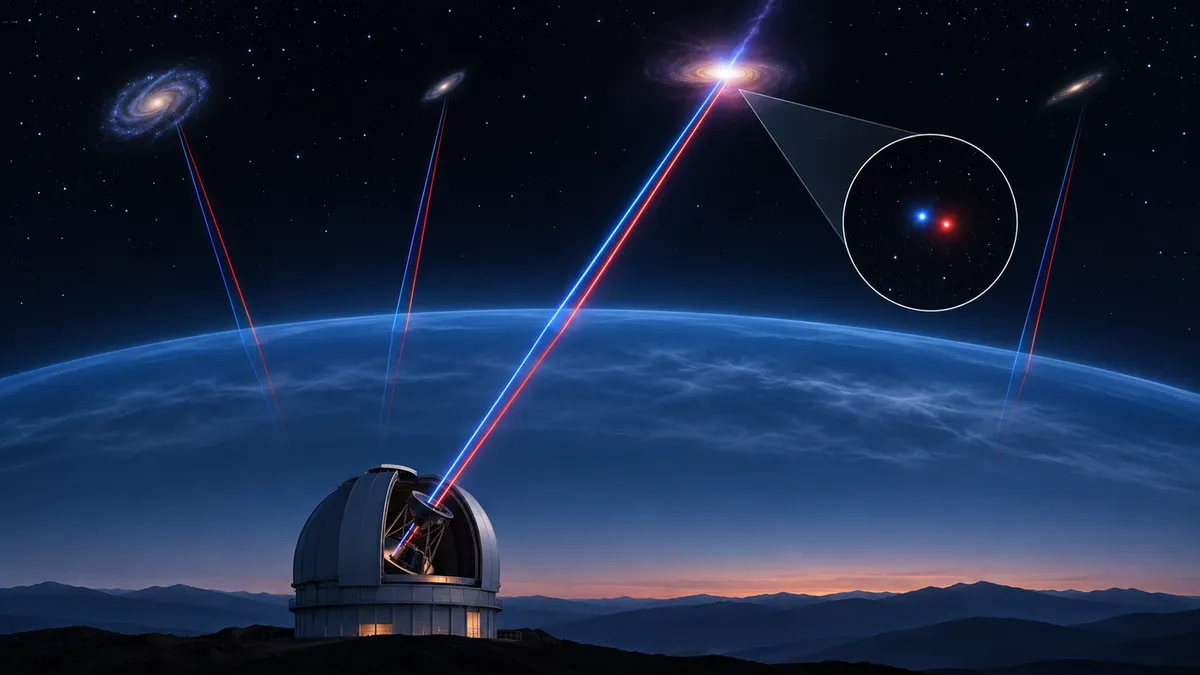
Earth’s atmosphere slightly separates the colours of incoming starlight, changing where distant objects appear in telescope images. A study of Rubin Observatory camera data shows how that distortion can also reveal useful information about the light from galaxies and quasars.
An atmospheric distortion usually treated as a nuisance could become an additional source of astronomical information. Matthew J. Temple and Phoebe N. Lister of Durham University report detecting differential chromatic refraction in galaxies and quasars observed during commissioning of the Vera C. Rubin Observatory’s LSST Camera.
Their paper, available as preprint version 2611.07161v1, describes how tiny changes in apparent position reveal differences in the distribution of light within a telescope filter. The authors argue that this information could complement the six-band colours used to estimate redshifts in Rubin’s Legacy Survey of Space and Time. They demonstrate informative patterns, rather than a measured improvement in redshift-estimation performance.
An atmospheric prism
The atmosphere bends blue light more strongly than red light, displacing it towards the zenith—the point directly overhead. The effect changes with airmass, a measure of how much atmosphere an observation looks through. Objects observed farther from the zenith are seen through more air.
LSST Camera has no atmospheric dispersion corrector in its optical path. Although calibration against reference stars removes much of the positional displacement, a difference remains when an object’s light has a different wavelength distribution from that of those stars. That residual is differential chromatic refraction, or DCR.
The key distinction is between a filter’s total brightness measurement and the distribution of light inside it. Two objects can have similar colours measured across broad filters while concentrating their light at different wavelengths within one filter. DCR offers a way to distinguish them.
Measuring repeated positional shifts
The researchers analysed 10,470 spectroscopically confirmed objects in the roughly 10-square-degree extended COSMOS field: 2,952 quasars, 4,305 red galaxies and 3,213 blue galaxies. Their previously measured spectroscopic redshifts provided a reference against which to examine the new signal.
The imaging came from LSST Data Preview 2, covering commissioning observations between April 2025 and January 2026. The team used individual detections in the u, g and r filters, retaining measurements with sufficiently strong detections and reliable position estimates. These supplied about 266,000 u-band, 626,000 g-band and 1.19 million r-band detections.
For each detection, they measured the positional difference from the object’s location in a deep, combined i-band image, then extracted the component pointing towards the zenith. They fitted how that offset changed with observing angle.
The fitted quantity was converted into a “characteristic wavelength”: the wavelength of single-colour light that would experience the same average atmospheric deflection as the object’s light within that filter. This is a compressed description of the light distribution, not a recovered spectrum.
Spectral features leave positional fingerprints
Quasars showed particularly clear patterns in the u band. Their strong emission lines shift through the filters as redshift changes. A line falling on a filter’s bluer side pulls the characteristic wavelength down; one on its redder side pushes it up.
The paper illustrates this with the carbon C IV and hydrogen Lyman-alpha lines. Around quasar redshifts of 1.5 and 2.2, respectively, these features lie in the red half of the u band, producing characteristic wavelengths above 375 nanometres. At redshifts around 1.2 and 1.8, they lie in the blue half, giving values below 370 nanometres.
Crucially, those positional clues do not simply repeat the information in u-minus-g colour. The authors show how they can distinguish redshift possibilities that otherwise have similar colours.
Red galaxies offered another example. Their r-band characteristic wavelength changes around redshift 0.4, which the researchers attribute to the 4000-angstrom spectral break moving through the filter. Galaxies with similar g-minus-r colours can therefore have different DCR measurements.
Promise, assumptions and preservation
Several approximations limit the present analysis. The model holds atmospheric temperature, pressure and humidity fixed, neglects changes in atmospheric extinction with airmass, represents calibration stars with a 5,000-kelvin blackbody spectrum, and assumes negligible DCR in the reference i-band image.
Fainter objects and those with fewer detections have less precise characteristic wavelengths. The displayed results exclude measurements based on fewer than ten detections or with wavelength uncertainties above five nanometres. These commissioning-field results do not establish performance across the full survey.
The authors also identify a practical risk: future processing is expected to correct chromatic positional effects more extensively. Such corrections are necessary before combining images, but could obscure useful information. Their recommendation is to preserve and release the correction parameters alongside the corrected data, allowing future studies to test whether atmospheric distortion can improve redshift estimates and sample selection.
- Vera C. Rubin Observatory
- LSST Camera
- differential chromatic refraction
- astrometry
- photometric redshifts
- quasars
- galaxies
- COSMOS field