TRANSMISSION // 2611.07044v1
Mapping M 81’s cold dust reveals spiral-arm structure—and the limits of a single temperature
Source published
Combining Herschel and JCMT observations, M. Uzuner and colleagues map dust across the spiral galaxy M 81. Their preprint finds dust concentrated along the spiral arms and warmer toward the centre, but inferred dust masses differ substantially between modelling methods. An outward rise in the atomic-gas-to-dust ratio is clearer than its implications for how dust grains grow.
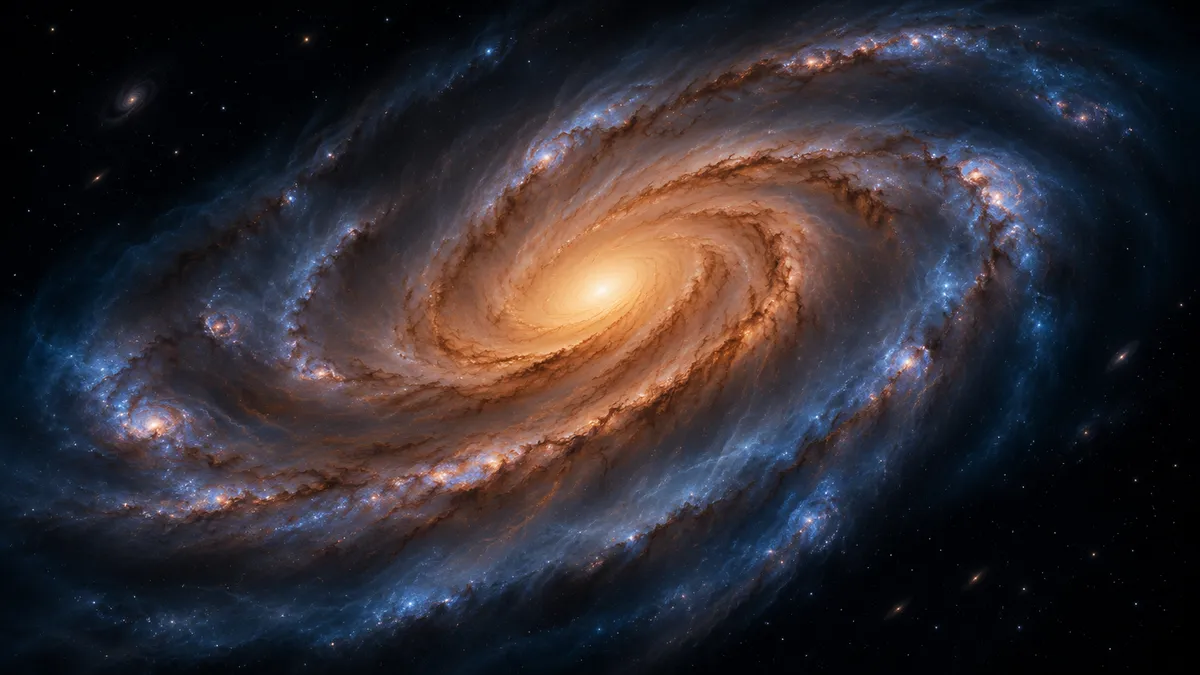
A galaxy’s brightest dust is not necessarily where most of its dust mass resides. A study of M 81 shows how allowing cold and warm material to coexist changes the inventory, while revealing a common picture of dust-rich spiral arms surrounding a warmer centre.
Dust grains absorb starlight and release that energy at infrared and submillimetre wavelengths. Those emissions let astronomers map material that participates in the interstellar environment where stars form. But turning brightness into a dust inventory requires assumptions about grain temperatures and how efficiently they radiate.
In a preprint, M. Uzuner and colleagues present the first results from DOWSING, the Dust Observations With SCUBA-2 In Nearby Galaxies survey. Their target is M 81, a nearby spiral galaxy at an adopted distance of 3.63 million parsecs. The study combines archival Herschel observations with new measurements from the SCUBA-2 camera on the James Clerk Maxwell Telescope, covering wavelengths from 70 to 850 micrometres.
Two ways to weigh dust
The authors compare two modelling approaches. A single-temperature modified blackbody fit assigns one effective dust temperature to each sightline. The alternative, Point Process MAPping, or PPMAP, distributes dust among several temperature components while accounting for each instrument’s resolution, avoiding the need to blur every input image to the same beam size.
The single-temperature analysis yields an integrated dust mass of 17.7 million solar masses, with a quoted observational uncertainty of 0.9 million. PPMAP yields 26.5 million solar masses, with an uncertainty of 1.3 million—about 50% more.
The authors interpret this difference as consistent with temperature mixing. Where warm and cold grains overlap, warmer material can dominate the emitted light. A single-temperature model can therefore favour a temperature that is too high to represent most of the mass, producing a lower mass estimate. PPMAP allows a larger contribution from colder material.
That does not make either inventory assumption-free. Both use the same adopted dust opacity, which converts emission into mass, and a fixed emissivity index of 1.9, describing how emission efficiency changes with wavelength. The quoted mass uncertainties represent a 5% observational allowance, not the full uncertainty in those physical assumptions. PPMAP also uses a selected temperature grid spanning 12–30 kelvin.
Dust-rich arms, a warmer centre
Both methods place enhanced dust surface densities along M 81’s spiral arms. The single-temperature maps give roughly twice as much dust per unit area in the arms as between them; PPMAP gives a contrast of about 1.6. However, the authors note that the arm boundaries were drawn around bright dust emission, so some enhancement is expected from the selection itself.
Both approaches also find warmer dust near the centre and cooler dust farther out. Their galaxy-wide median map temperatures differ: 20.1 kelvin for the single-temperature fits and 16.5 kelvin for PPMAP’s mass-weighted temperatures.
The authors interpret the central warmth primarily as heating by the stronger stellar radiation field, particularly the evolved population in the bulge. This is an interpretation supported by earlier work discussed in the paper, rather than a direct separation of heating sources in these maps. They also identify a nuclear 850-micrometre excess, interpreted as likely non-thermal emission, and add a synchrotron component when refitting affected pixels.
A separate northern region shows a possible long-wavelength excess at only about 2.06 standard deviations. The authors do not regard it as statistically significant evidence for an additional emission component.
More gas relative to dust farther out
Combining the single-temperature dust map with atomic hydrogen observations and an allowance for helium, the team finds an outward increase in the gas-to-dust ratio. Between radii of 3 and 9 kiloparsecs, its logarithm rises by 0.065 ± 0.002 dex per kiloparsec.
This is primarily an atomic-gas-based measurement, not a complete inventory of all gas. Carbon monoxide observations provide estimates of molecular gas over only part of the disc. Including that component raises the inferred ratios, especially near the centre, where the correction is poorly constrained.
Whether the radial trend means a smaller fraction of heavy elements becomes dust farther out is less secure. One published metallicity gradient supports that interpretation, potentially consistent with more efficient grain growth inward. Other metallicity measurements allow a nearly constant or weakly increasing dust-to-metals ratio. The study therefore does not establish a unique grain-growth history.
Star formation follows the arms
Using ultraviolet and infrared emission, the authors estimate a star formation rate of 0.27 ± 0.03 solar masses per year from valid, unmasked pixels. The median rate per unit area is about 7.6 times higher in the arms than between them.
Much of the centre falls outside the calibration’s valid range and is excluded; missing values do not demonstrate absent star formation. Faint-pixel masking also affects the dust maps, potentially flattening outer radial profiles. Within these limits, the strongest shared result is spatial: M 81’s dust and recent star formation trace its spiral structure, while its centre contains warmer dust.
- M 81
- interstellar dust
- DOWSING
- SCUBA-2
- Herschel
- dust temperature
- gas-to-dust ratio
- spiral galaxies