TRANSMISSION // 2611.05909v1
Mammography AI heat maps perform worse in dense breasts—but the reasons matter
Source published
Ahmed Jaheen’s preprint reports that three AI explanation methods localized cancers less well in dense-breast mammograms before adjustment. Differences in lesion type explained much of the gap, while the remaining disparities depended on the classifier and statistical assumptions. The retrospective study does not establish clinical harm or prove that any explanation method is universally fair.
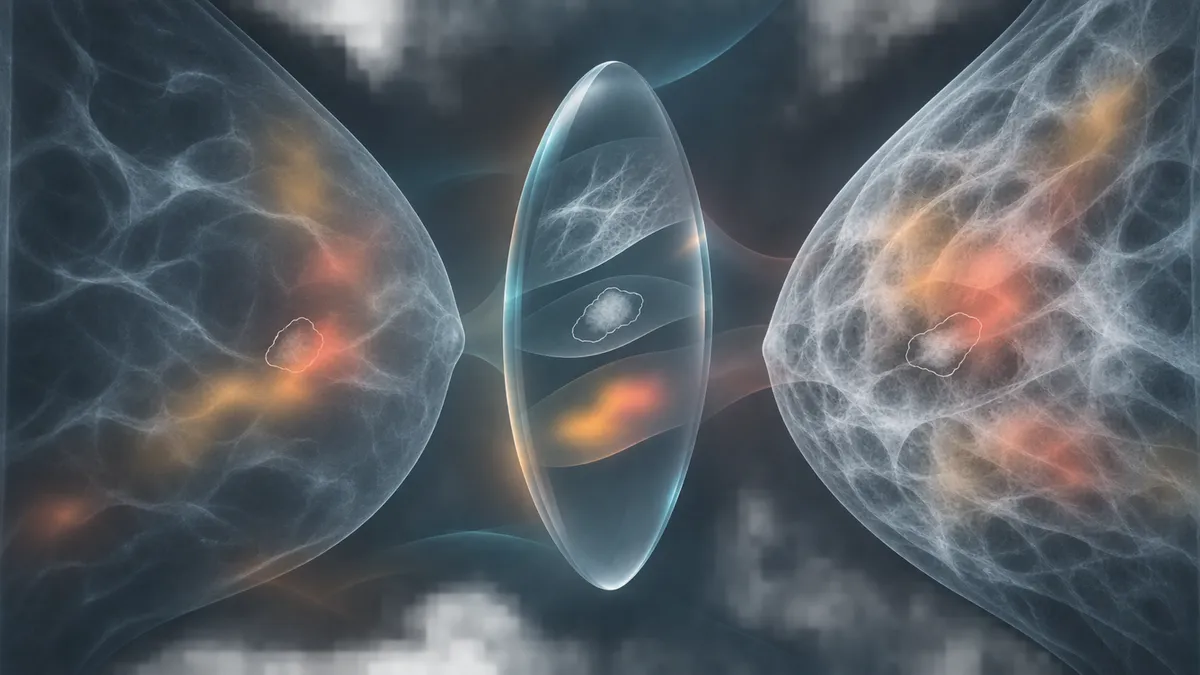
A bright patch on an AI-generated heat map can look reassuring: apparently, the computer is looking at the cancer. But does that visual explanation work equally well when dense breast tissue makes a mammogram harder to interpret? A new preprint finds substantial initial differences—and shows why a simple comparison can mislead.
A heat map is not proof
Dense breast tissue appears white on mammograms, as many cancers do. That overlap can make lesions harder to see. It also raises a question for artificial intelligence: when a model classifies an image, does its accompanying explanation highlight the lesion equally well across breast-density groups?
In a preprint posted on November 4, 2026, Ahmed Jaheen of New York University examines that question using three image classifiers and three explanation methods. The central finding is qualified: maps performed worse in dense breasts before adjustment, but differences in the kinds of lesions present explained much of the disparity.
What the study measured
Jaheen’s primary analysis used 1,345 malignant mammographic views from 751 patients in CBIS-DDSM, a public collection of digitized film mammograms. Of these views, 632 were classified as dense and 713 as non-dense. A view is an image, not a separate patient.
The classifiers were ResNet-50, EfficientNet-B3 and ConvNeXt-T. Patient-grouped cross-validation kept each evaluated patient out of the corresponding classifier’s training data. The explanation methods—Grad-CAM, Integrated Gradients and occlusion—produce maps intended to show image regions supporting the malignancy score.
Two measures compared those maps with radiologists’ lesion outlines. The “pointing game” counted whether a map’s strongest point landed within a five-millimetre zone around the lesion. “Energy lift” compared saliency per pixel inside the lesion with that in the remaining breast tissue, normalized against a uniform-map baseline. An increase of one bit represents a doubling of that lesion-to-background ratio.
These are computational measurements on existing patient images, not simulated patient outcomes. Experiments that blurred or replaced pixels were artificial probes of model behaviour, not clinical interventions.
Large initial gaps, smaller adjusted differences
Before adjustment, all three explanation methods scored worse in dense breasts. Grad-CAM’s peak landed near the lesion in 44% of dense-breast views, compared with 58% of non-dense views—roughly 14 fewer hits per 100 cancer-containing images.
But the groups differed in more than density. Calcifications, clusters of small calcium deposits, were more common in dense breasts: 58.7% versus 31.8%. These lesions received lower energy-lift scores than masses. Breast size and other image characteristics also differed.
Adjusting for case mix removed 81% of the Grad-CAM energy-lift gap, all of the Integrated Gradients gap and about half of the occlusion gap. In the primary adjusted analysis, occlusion retained a statistically significant difference of −0.56 bit after correction for multiple comparisons. That corresponds to a roughly 32% lower lesion-to-background saliency ratio in dense breasts.
That result was not stable across every analytical choice. The occlusion gap was concentrated in EfficientNet-B3. An exploratory analysis allowing case-mix relationships to differ between explanation methods found no statistically significant adjusted energy-lift gap for any method. Those sensitivity results make a blanket claim that occlusion fails dense breasts unjustified.
The classifier matters too
Jaheen also tested whether the disparities reflected image visibility, learned model behaviour or the explanation methods themselves.
An image-only contrast map showed a density gap, consistent with lesions standing out less in dense tissue. The explanation methods’ unadjusted gaps were larger, although only occlusion’s excess remained significant after the relevant multiple-comparison correction. Randomizing network weights removed the density gaps in the tested settings. Pixel-replacement experiments also suggested that classifiers relied less on lesions in dense-breast images.
Together, these controls implicate classifier behaviour as part of the problem. They do not establish a single causal mechanism, nor does highlighting a lesion prove that a classifier genuinely bases its decision on it.
What remains uncertain
The study uses one digitized-film dataset and reader-assigned density labels. Its findings need replication on contemporary digital mammograms. All included images contained lesions already identified by radiologists: this was malignant-versus-benign classification, not screening for previously unseen cancers. Cancers completely hidden by dense tissue were absent.
Adjustment also changes the question. Lesion type may be a confounding difference, but it could partly reflect how density affects detection. Controlling for it might therefore remove part of a meaningful density-related disparity. The reported adjusted associations are not causal effects.
Most analyses used one training seed. The available PDF extraction also interleaves columns and damages formulas and table layout; this account relies on explicit prose findings rather than reconstructing missing figures.
Jaheen’s recommendation is consequently about better auditing: report both raw and adjusted gaps for each classifier, alongside visibility and lesion-reliance controls. A reassuring heat map alone is insufficient evidence of an equitable explanation.
- mammography
- breast density
- explainable AI
- saliency maps
- algorithmic fairness
- Grad-CAM
- medical imaging
- preprint
Related reading
Automatically matched by shared topic keywords. These links do not imply that the sources agree or establish a consensus.
EvoML checks machine-learning pipelines in stages and retains successful repairs
Source published
Shared keywords: medical imaging
Fast, Cheap—and Fair? A Recruitment AI Audit Finds Different Answers
Source published
Shared keywords: algorithmic fairness
Estimating the Best Accuracy AI Can Achieve Under Fairness Constraints
Source published
Shared keywords: algorithmic fairness