TRANSMISSION // 2611.05519v1
Simulated Stars Put Milky Way Mass Measurements to the Test
Source published
Alexander H. Riley and colleagues present 24 simulated stellar catalogues designed to test methods for measuring the Milky Way’s mass with DESI. The catalogues reproduce important survey effects, but comparisons with real stars reveal differences in their distances, chemical composition and motions.
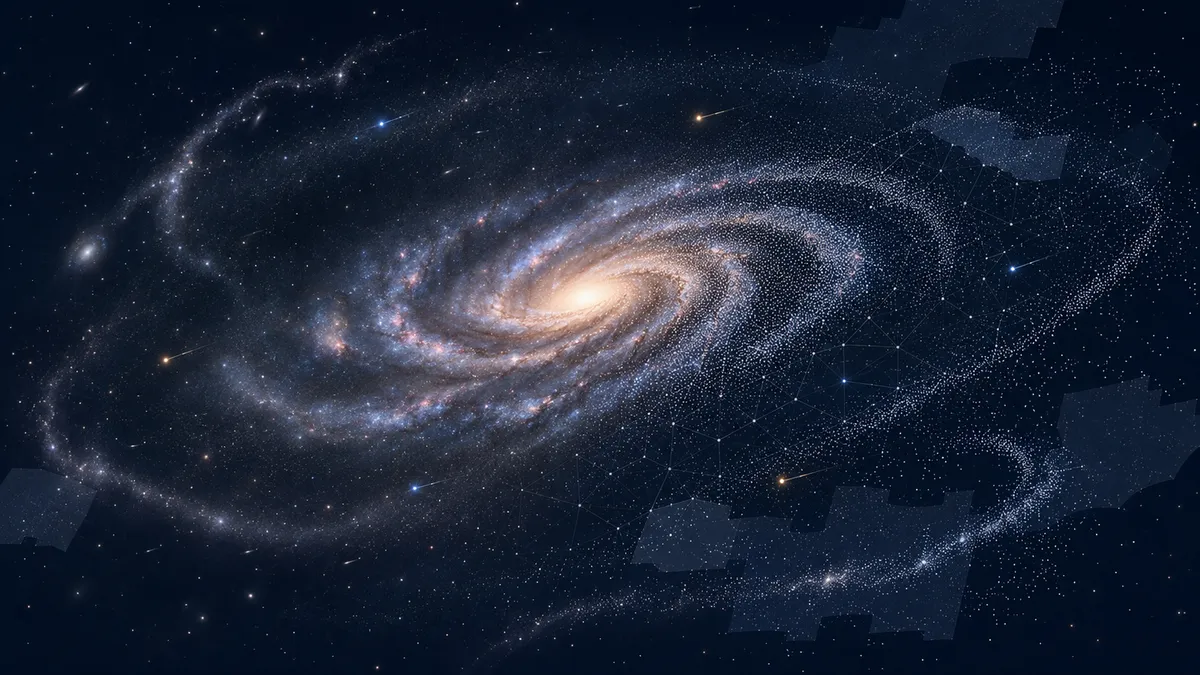
Before trusting a method to weigh our Galaxy, astronomers can try it on a simulated galaxy whose mass is already known. New AuriDESI catalogues provide that testing ground—and show why realistic observing conditions alone cannot guarantee a perfect match to the Milky Way.
A rehearsal for weighing the Galaxy
Measuring the Milky Way’s mass requires more than collecting large numbers of stars. Astronomers must account for measurement errors, uneven sky coverage and groups of stars that move together rather than independently. Alexander H. Riley and colleagues in the DESI Collaboration present simulated stellar catalogues designed to test how mass-measurement methods handle these complications.
Their paper, posted as an arXiv preprint and submitted to The Open Journal of Astrophysics, supports a broader project using the Dark Energy Spectroscopic Instrument’s second data release, DR2. It supplies a testing resource, not a new numerical measurement of the Galaxy’s mass. The mass estimates and their combined interpretation belong to companion studies.
Building a survey from simulated galaxies
The researchers build on AuriDESI, a framework that turns galaxies from the Auriga cosmological simulations into catalogues resembling astronomical observations. Their starting point is six simulated Milky Way-mass galaxies, each viewed from four observer locations. The resulting 24 mock surveys therefore represent different perspectives on six galaxies, not 24 independent galaxy histories.
Unlike a model built from a smooth stellar distribution, these simulations contain satellites, stellar streams and debris from earlier mergers. That structure matters because the methods being tested must work in a galaxy whose stars do not necessarily form a perfectly settled system.
The catalogues focus on two types of distance tracers: RR Lyrae variable stars and blue horizontal branch stars. Their distances, combined with positions and motions, provide the six-dimensional information—three position coordinates and three velocity components—used in the mass-modeling effort. After selection cuts, the observed DESI samples contain 4,838 RR Lyrae stars and 5,198 blue horizontal branch stars, reaching roughly 90 kiloparsecs from the Galactic centre.
Making the observations imperfect
Riley and colleagues tailor the mocks to the survey’s footprint, brightness limits and varying completeness: the probability that an eligible star actually enters the observed sample. For RR Lyrae stars, that probability includes selection effects from both DESI and the Gaia input catalogue.
They also add measurement errors. Proper-motion uncertainties follow Gaia’s average performance, while line-of-sight velocity uncertainties are modeled using the actual DR2 tracer samples. RR Lyrae stars require special treatment because their pulsations change their measured velocities over time.
Some choices deliberately simplify reality. Both tracer types receive a uniform 5% distance uncertainty, although the observed RR Lyrae catalogue typically has uncertainties near 2%. The mock classification also divides the two populations at a temperature of 7,000 kelvin, rather than reproducing the full complexity of stellar pulsation.
The authors flag satellite members and massive stellar streams so analysts can exclude them, broadly paralleling removals from the observed data. Smaller streams and more thoroughly dispersed merger debris remain.
Where the simulated stars differ
The comparisons reveal an important mismatch in distance. About 80% of the observed tracers lie within 30 kiloparsecs of the Galactic centre, compared with roughly 50% in the mocks. Beyond 50 kiloparsecs, the fractions are approximately 5% and 20%, respectively. These differences persist after the mock samples are reduced to approximately comparable star counts.
The authors discuss possible contributions from the simulated galaxies’ stellar distributions and the stellar-evolution prescriptions used to generate individual stars. Neither explanation is established as the sole cause. Auriga’s overly massive stellar haloes also produce too many tracers before the final count reduction.
Chemical composition provides another warning. The simulated tracer populations have narrower iron-abundance distributions than the observations, and simulated blue horizontal branch stars are generally more iron-poor. Radial velocity distributions agree reasonably well overall, but the mocks lack a nearby population with low tangential speeds. Matching some survey properties therefore does not mean matching every relevant stellar property.
A benchmark with boundaries
The authors emphasize that these catalogues combine three ingredients: cosmological simulations, stellar-population models and survey modeling. A disagreement with observations can arise from more than one ingredient, making its origin difficult to isolate.
The mocks are also unsuitable for every Galactic problem. The authors identify limitations involving globular clusters, accreted systems below a nominal stellar-mass resolution of one million solar masses, and disturbances from a nearby massive satellite like the Large Magellanic Cloud.
As future improvements—not demonstrated results—they propose exploring multiple stellar-evolution models and simulation suites. The current catalogues and the simulations’ true cumulative mass profiles are publicly available on Zenodo. Their value is a controlled benchmark: researchers can compare a method’s inferred mass with a known simulated answer while keeping the differences from the real Milky Way in view.
- Milky Way
- DESI
- AuriDESI
- Auriga simulations
- Galactic mass
- stellar halo
- RR Lyrae
- blue horizontal branch stars
- mock catalogues
Related reading
Automatically matched by shared topic keywords. These links do not imply that the sources agree or establish a consensus.
Distant Stars Give Two Different Estimates of the Milky Way’s Mass
Source published
Shared keywords: blue horizontal branch stars
Halo Stars Help Put the Milky Way’s Mass Near 1.3 Trillion Suns
Source published
Shared keywords: blue horizontal branch stars, milky way, rr lyrae
DESI Halo Stars Point to a Milky Way Mass of About 1.2 Trillion Suns
Source published
Shared keywords: blue horizontal branch stars, stellar halo
Stellar motions reveal clues to NGC 253’s merger history
Source published
Shared keywords: stellar halo
A Sharper View of the Milky Way’s Hidden History
Source published
Shared keywords: milky way