TRANSMISSION // 2611.05482v1
Euclid simulations expose the galaxies a bright-line survey can miss
Source published
A Euclid Collaboration preprint forecasts how the mission could measure star formation, dust and chemical enrichment—and why accurate measurements of detected galaxies need not represent the wider population.
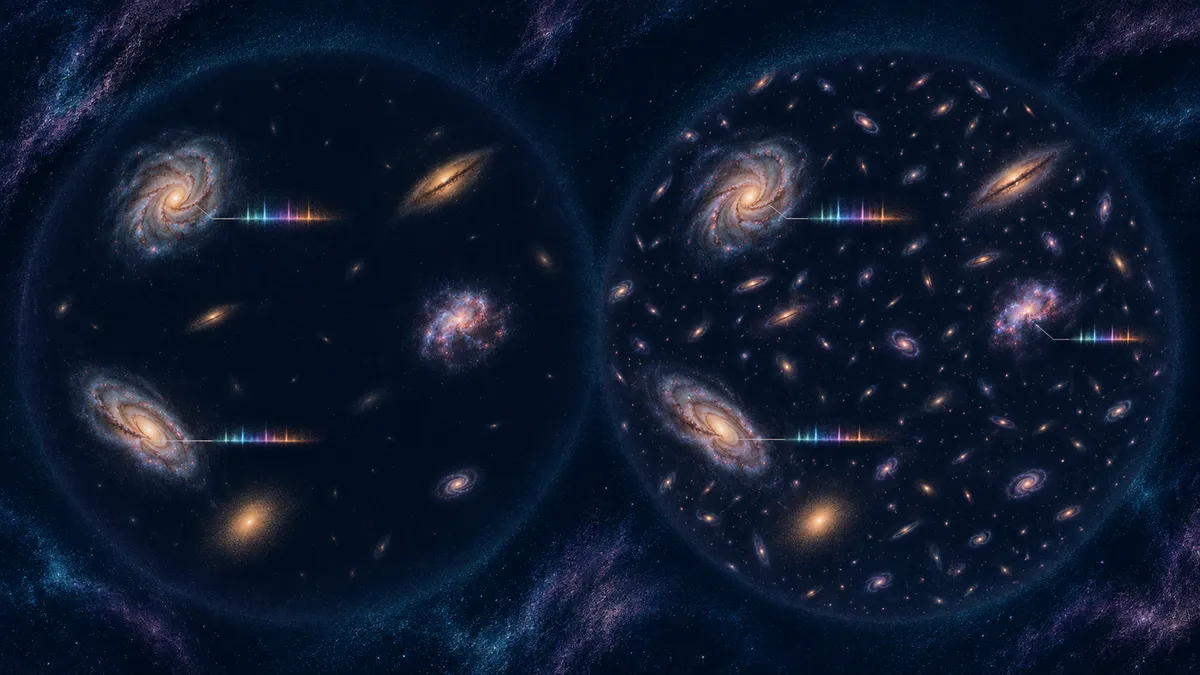
Simulations by C. Mancini and colleagues show how emission-line detection limits can distort Euclid’s view of galaxy evolution. Deeper observations help, but do not remove every selection bias.
Euclid’s view of galaxy evolution will depend not only on how many spectra it collects, but also on which galaxies enter its samples. C. Mancini and colleagues in the Euclid Collaboration forecast that the mission’s wide spectroscopic survey will preferentially select strongly star-forming galaxies, distorting relationships used to understand galaxy growth.
Their study, Euclid. Predicting scaling relations for emission-line galaxies using simulated data, is arXiv:2611.05482v1, submitted on 3 November 2026. The landing page lists it as submitted to Astronomy & Astrophysics, not an accepted journal publication. These are forecasts for the surveys’ final planned DR3 depth, not new measurements of observed galaxy populations.
A rehearsal with synthetic galaxies
The team investigated three connections with stellar mass: star-formation rate, dust attenuation around star-forming regions, and the abundance of elements heavier than helium in galactic gas. These relationships help astronomers investigate how galaxies acquire gas, form stars and become chemically enriched.
Their starting point was MAMBO, a mock galaxy catalogue covering 3.14 square degrees, built from a cosmological dark-matter simulation and empirical prescriptions. The catalogue already incorporates assumptions about mass, star formation and metallicity. The exercise therefore tests recovery of an assumed population, rather than independently discovering those relationships.
FastSpec generated synthetic spectra with instrumental characteristics and background noise. Euclid’s official spectroscopic measurement pipeline then measured redshifts and emission-line fluxes. Comparisons with known inputs and line-flux-limited samples helped separate measurement errors from selection effects.
Bright galaxies are not the whole population
The star-forming main sequence describes how star-formation rate varies with stellar mass. In the wide-survey simulations, the brightness threshold excludes many less actively star-forming galaxies. The recovered sequence sits too high and becomes artificially flatter at lower masses. Its apparent shape need not indicate different galaxy physics.
The deeper survey substantially reduces this problem. For galaxies above about twenty billion solar masses, hydrogen-alpha detections almost completely sample the simulated sequence at redshifts 0.42–0.84. A residual offset of about 0.2 dex remains at 0.84–1.88. At the highest redshifts studied, oxygen-line selection increasingly favours higher star-formation rates.
Dust produces a related trap. The team estimated attenuation from the H-alpha to H-beta flux ratio, the Balmer decrement. For detected galaxies, inferred attenuation generally agreed with the simulated inputs. But requiring the fainter H-beta line excludes heavily obscured galaxies, particularly in the wide survey. Reliable individual estimates therefore need not yield a representative dust–mass relationship.
The source contains a redshift-boundary discrepancy: the landing-page abstract, copied into metadata.json, gives the wide-survey dust–mass interval as 1.45 ≤ z ≤ 1.88. The supplied PDF abstract also says 1.45, whereas Section 4, Figure 7’s caption, Section 5 and Appendix B use 1.49 ≤ z ≤ 1.88. This account follows those detailed sections; the deep-survey interval is 0.9 ≤ z ≤ 1.88. The discrepancy is in the source, not a metadata transcription error.
The authors also caution that MAMBO may overestimate dust attenuation relative to earlier observational work. If real galaxies are less obscured, deep-survey recovery could improve.
A selective golden sample
A deep-survey “golden sample” at redshifts 1.49–1.88 provides multiple emission lines for estimating gas-phase metallicity. Typical uncertainties are about 0.1 dex for higher-metallicity galaxies, corresponding in the model to masses of at least ten billion solar masses. Lower metallicities can be overestimated by up to 0.15 dex. Relative to the broader near-infrared-selected mock population, this sample favours higher star-formation rates and lower metallicities at fixed stellar mass.
FastSpec omits overlapping spectra, cosmic rays and detector persistence, potentially making performance optimistic. Conversely, its fixed extraction aperture loses light from some nearby, extended galaxies. The main sequence analysis uses known input stellar masses and dust corrections; a simplified photometric exercise preserves average trends but adds uncertainties and some slope changes.
The benchmark distinguishes measuring detected galaxies well from representing a population fairly. Real observations must validate it. Source basis: the complete supplied paper text, version-one landing page and landing-derived metadata. PDF text extraction can damage equations and layout and omits images; no independent observational verification is claimed.
- Euclid
- galaxy evolution
- spectroscopy
- selection bias
- star formation
- dust attenuation
- metallicity
- astronomical simulations
- preprint
Related reading
Automatically matched by shared topic keywords. These links do not imply that the sources agree or establish a consensus.
Euclid forecast points to millions of galaxy spectra, with oxygen-line counts less certain
Source published
Shared keywords: galaxy evolution
Galactic Light Echoes Reveal Candidates for Fading Black Hole Activity
Source published
Shared keywords: galaxy evolution
How JWST Could Trace the Seeds of the First Massive Black Holes
Source published
Shared keywords: galaxy evolution
When Dropping Incomplete Records Can Preserve a Causal Estimate
Source published
Shared keywords: selection bias
Can statistical ‘digital twins’ help evaluate job training?
Source published
Shared keywords: selection bias