TRANSMISSION // 2611.05476v1
Bright gas clumps can skew galaxy-cluster measurements. A median helps
Source published
A CHEX-MATE simulation study finds that median-based reconstructions better resist bright gas substructures, but viewing angle and observational resolution still limit what astronomers can infer about individual galaxy clusters.
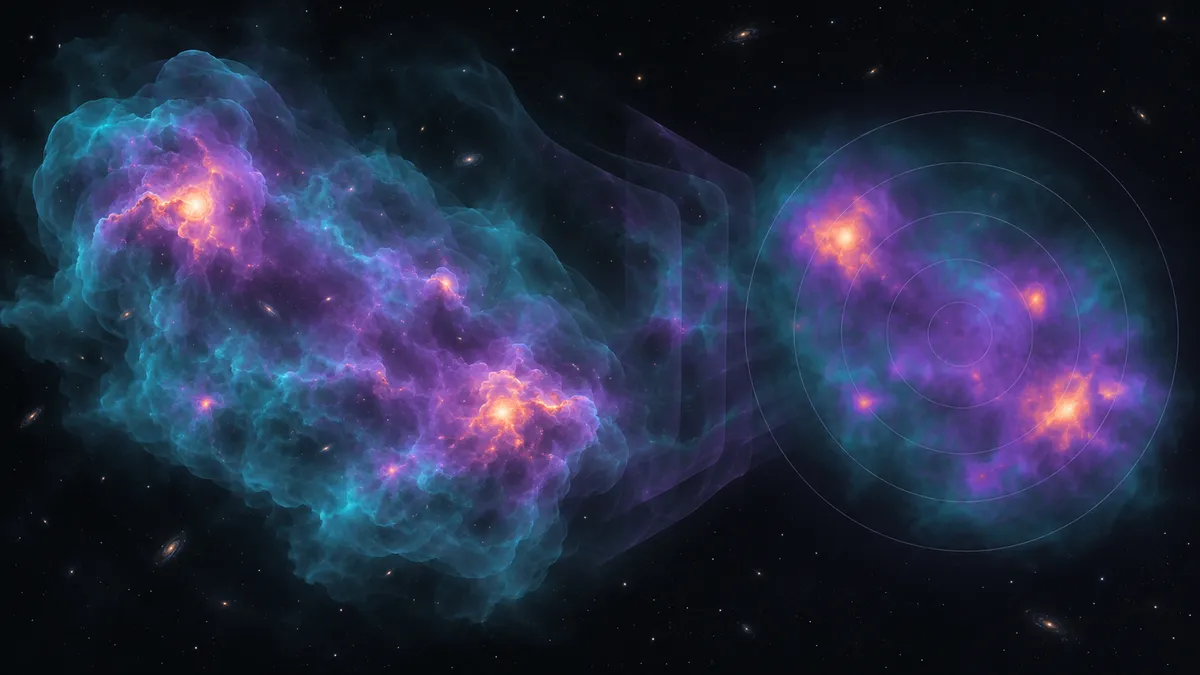
The hot gas between a galaxy cluster’s galaxies is not a smooth atmosphere. Dense knots and ongoing mergers complicate efforts to reconstruct its structure from X-ray images. I. Bartalucci and colleagues report that taking the median brightness around a cluster can reduce those distortions—without making the underlying geometry disappear.
Galaxy clusters contain hot, ionised gas whose density helps astronomers estimate gas mass and investigate pressure, entropy and total cluster mass. But an X-ray image compresses a three-dimensional gas distribution into a single view. Bright substructures can then distort the reconstruction of how density changes with distance from the centre.
In a CHEX-MATE study, I. Bartalucci and colleagues find that a median-based method largely resists those distortions across their simulated sample. Their conclusion is not to abandon conventional averages: the two approaches retain different strengths, particularly when researchers need to examine cluster cores.
Rebuilding a cluster from its projected image
The team analysed 109 galaxy clusters from The Three Hundred simulation suite, selected to resemble the CHEX-MATE observational sample in mass, redshift and, where possible, morphology. Six simulated clusters were excluded because their central regions contained too few gas particles for the analysis.
For each cluster, the researchers generated emission-measure maps along 40 lines of sight. These maps describe the density-squared contribution of hot gas integrated along the viewing direction, closely related to its X-ray brightness. Crucially, simulations also supply the underlying three-dimensional gas distribution, allowing a direct check of the reconstructed profiles.
The authors divided each projected image into concentric rings and calculated either the mean pixel intensity or the median—the middle value of the intensity distribution. They then used deprojection, assuming spherical symmetry, to infer the radial gas density. They compared both a flexible reconstruction and an approach that fits an analytical density model.
Most sample-wide comparisons used one randomly selected viewing direction per cluster. The full set of directions was used to measure how much the answer changes with orientation. For the principal mean-profile analysis, visible substructures were masked in the selected maps; median profiles were extracted without masking.
A useful improvement, not perfect recovery
The median is less sensitive than the mean to a small number of unusually bright regions. That matters because dense gas clumps can pull an average upward without representing the surrounding bulk gas.
The authors report broadly accurate median-based density reconstructions. Their detailed results nevertheless show residual differences: at the reference radius R500, the sample’s median reconstructed-to-true density ratio was 0.94, with a median absolute deviation of 0.25. R500 denotes the radius enclosing an average total matter density 500 times the critical density at the cluster’s redshift. The result therefore should not be read as an exact recovery for every object.
Mean-based profiles remained more vulnerable to substructure. Even after masking, the paper reports typical density overestimates of roughly 5–8 percent over the radii discussed in its conclusions. Agreement between the reconstruction algorithms was better when the input profiles were smooth; inadequately removed substructures made analytical fits more problematic.
The difference also affected estimated gas mass within R500. Median-based profiles produced a sample median recovered-to-true mass ratio of 1.01, compared with 1.10 for mean-based profiles. Those central ratios coexist with substantial object-to-object spread. A visually selected subset of particularly regular, relaxed clusters also gave accurate mean-based gas masses, underscoring the importance of morphology.
What the method cannot reveal
Changing the viewing direction introduced density scatter of about 6 percent for median profiles. Mean-profile scatter increased toward the outskirts, reaching about 13 percent at R500. A robust summary statistic cannot remove the ambiguity of observing a non-spherical object from only one direction.
Nor can the ratio of mean to median density provide a reliable measurement of three-dimensional gas clumpiness for an individual cluster. The authors find population-level trends, but projection, large-scale shape and unresolved fluctuations produce substantial scatter. Interpreting that ratio as a direct clumping measurement would overstate the evidence.
There are observational limits, too. The main maps contain neither astrophysical background nor instrumental noise, although the authors report consistent results in a comparison with mock XMM-Newton observations. In real images, estimating a stable median requires grouping the signal into adaptive cells, sacrificing spatial resolution. Mean profiles therefore remain useful for probing the innermost gas.
This article is based on the supplied extracted paper text, the versioned arXiv landing page and its derived metadata. The source is preprint arXiv:2611.05476v1, submitted on 3 November 2026; the landing page states that it was accepted for publication in Astronomy & Astrophysics. The supplied text extraction omits images and may damage equations or layout. The evidence supports a methodological improvement in simulations, not a guarantee of accurate measurements for every observed cluster.
- galaxy clusters
- CHEX-MATE
- X-ray astronomy
- intracluster medium
- gas density
- cosmological simulations
- projection effects
Related reading
Automatically matched by shared topic keywords. These links do not imply that the sources agree or establish a consensus.