TRANSMISSION // 2611.05468v1
How Choices About Red Giant Stars Change the Inferred Expansion Rate
Source published
The CosmoVerse Data Challenge found substantial differences in inferred cosmic expansion rates when participants analyzed shared stellar catalogs. The preprint traces those differences to galaxy selection and distance measurements, without offering a new combined Hubble constant.
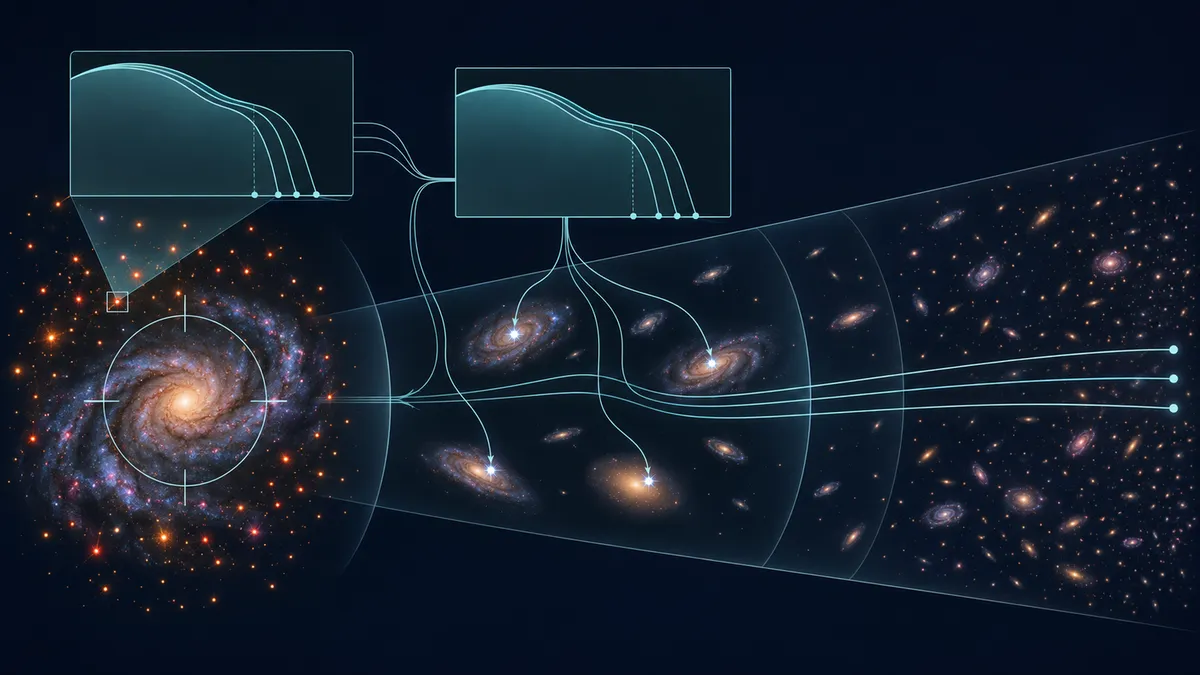
A shared dataset does not guarantee a shared answer. An astronomy challenge makes the consequences of researchers’ choices visible, from selecting stars to deciding which galaxies belong in a measurement.
Measuring how fast the Universe expands requires more than collecting light. Astronomers must decide which objects to trust, how to analyze them and how to connect nearby distances to distant galaxies. The CosmoVerse Data Challenge explores how those decisions affect the answer—even when researchers share data and much of their software.
In an arXiv preprint submitted on November 3, 2026, Siyang Li and colleagues report 26 submissions from 22 participants. Their inferred Hubble constants varied substantially. But the authors explicitly caution against treating that spread as a new measurement of cosmic expansion, or as an estimate of the systematic uncertainty in published measurements using red giant stars. The supplied version is a preprint; its posting does not establish peer review.
A stellar landmark on the distance ladder
The Hubble constant, H0, describes the Universe’s present-day expansion rate. It sits at the center of the Hubble tension: the disagreement between estimates inferred from the early Universe under the standard cosmological model and measurements built from comparatively nearby objects.
This challenge examined one ingredient of the local distance ladder: the tip of the red giant branch, or TRGB. Old, low-mass red giant stars brighten until helium ignition ends that evolutionary phase. Across a suitable stellar population, this produces a recognizable cutoff in brightness. Comparing its apparent brightness with a calibrated intrinsic brightness gives a galaxy’s distance.
The ladder then extends outward. A nearby galaxy with a geometrically measured distance calibrates the stellar landmark. Measuring that landmark in galaxies that hosted Type Ia supernovae calibrates the supernovae, which can be observed much farther away. Their distances and redshifts then yield H0.
The difficulty is that the stellar cutoff is not always clean. Which stars enter the analysis, and how their brightness distribution is processed, can change where the apparent edge falls.
What participants could change
The organizers provided public Hubble Space Telescope stellar catalogs from two sources, EDD and CATs, covering the anchor galaxy NGC 4258 and 17 other galaxies. Fourteen of those other galaxies hosted supernovae included in the challenge’s fitting dataset.
Participants chose catalogs, galaxies and analysis settings. They could adjust stellar color selections, smoothing and spatial exclusions, among other options. A shared notebook detected the brightness cutoff with an edge-finding filter and used bootstrap resampling to estimate its uncertainty.
The supernova stage was held fixed: everyone used the same Pantheon+ compilation, covariance information and fitting procedure. However, choosing different host galaxies also changed which calibrating supernovae entered each fit. This was therefore a comparison of analysis and sample-selection choices within a common framework, not a contest among wholly independent measurement techniques.
Where the answers diverged
The submissions ranged from 67.91 to 99.32 kilometers per second per megaparsec. Their median was 77.10, with a standard deviation of 7.38 in the same units. The median quoted uncertainty of an individual submission was 2.16. An alternative spread statistic less sensitive to extreme values was 5.11—still substantially larger than that typical uncertainty.
According to the authors, galaxy selection accounted for a large part of the variation. Four galaxies—NGC 1309, NGC 3021, NGC 3370 and NGC 5584—were especially consequential because their stellar tips were difficult to detect. Among the 14 submissions containing at least one of these galaxies, removing them lowered H0 by a median of 6.5 kilometers per second per megaparsec.
The authors describe a possible explanation: detecting an edge brighter than the true tip could place a galaxy too close, making its supernova appear intrinsically fainter and raising H0. The challenge does not establish that cause.
The anchor mattered too. Different measurements of the stellar tip in NGC 4258 shifted a submission’s galaxy distances together. Replacing each submission’s anchor-tip measurement with the median changed H0 by an amount whose standard deviation was about 3 kilometers per second per megaparsec.
What the spread cannot establish
These results do not identify the correct expansion rate. Participants shared catalogs, software and supernova data, so their answers were correlated rather than independent measurements to combine. Many were trainees, the challenge was not blinded, and the true target-galaxy distances were unknown.
The quoted fit uncertainties also omitted covariance between galaxy distances arising from their common anchor. Moreover, the exercise tested edge detection within one notebook, not alternative methods that model the stellar brightness distribution directly.
The contribution is therefore methodological: the authors show how choices propagate through a distance ladder and make those choices available for scrutiny. That helps turn disagreements between final numbers into specific questions about measurements—without claiming to resolve the Hubble tension.
- Hubble constant
- Hubble tension
- tip of the red giant branch
- cosmic distance ladder
- CosmoVerse Data Challenge
- Type Ia supernovae
- NGC 4258
- analysis choices
Related reading
Automatically matched by shared topic keywords. These links do not imply that the sources agree or establish a consensus.