TRANSMISSION // 2611.03790v2
Fading galaxies could reveal why the early universe looks so bright
Source published
A modeling study proposes that galaxies caught after star-forming bursts could help distinguish stronger bursts from more efficient star formation as explanations for JWST’s unexpectedly abundant bright early galaxies.
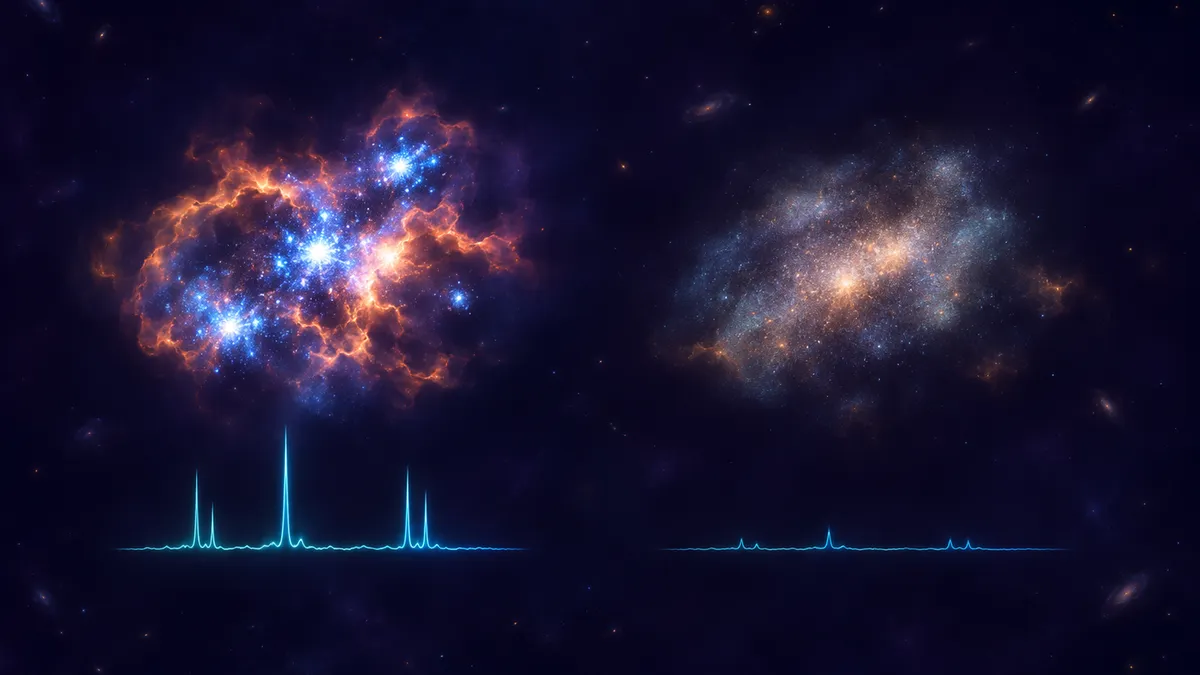
The brightest early galaxies may tell only half the story. To understand why JWST sees so many of them, astronomers may also need to count galaxies whose star formation has recently slowed.
Two ways to brighten the early universe
JWST has found unexpectedly numerous ultraviolet-bright galaxies at redshifts above 10, probing the universe’s earliest stages. By redshift 14, the universe was roughly 300 million years old. Many galaxy-formation models struggle to explain how so many luminous systems appeared so early.
There are two broad possibilities: galaxies could form stars more efficiently, or their star formation could fluctuate more dramatically. Brief bursts could make otherwise faint galaxies temporarily conspicuous. Simply counting galaxies at different ultraviolet brightnesses—the ultraviolet luminosity function—cannot readily distinguish these explanations.
In an arXiv preprint submitted to The Astrophysical Journal, Viola Gelli and colleagues investigate whether galaxies’ spectra can separate them. Their central proposal is counterintuitive: look for the aftermath of bursts, not just the bursts themselves.
Building synthetic galaxy populations
The researchers constructed an analytical model connecting dark-matter halo growth, star formation and emitted light. At each redshift, they sampled at least ten million synthetic halos, including small systems capable of cooling gas through atomic processes.
A baseline star-formation rate follows the supply of ordinary matter entering each halo. Random fluctuations then produce alternating periods of stronger and weaker activity. The model makes these fluctuations larger in lower-mass halos, where feedback from stars can more readily disrupt gas supplies.
The team converted these histories into spectra using Starburst99 stellar-population models. This is not a simulation that directly follows gas flows or individual supernova explosions; it is a statistical framework for predicting populations and their light.
The researchers calibrated it at redshift six using galaxy counts and previously inferred recent star-formation histories for 368 galaxies. Their preferred parameters include a characteristic variability timescale of 50 million years. For halos containing ten billion solar masses, the resulting scatter in ultraviolet magnitude is about 0.9 magnitudes.
Importantly, burstiness does more than redistribute brightness in this framework. Because the fluctuations are modeled in logarithmic space, strong episodes also raise average star formation above its median baseline. The two explanations are therefore not a clean contrast between unchanged total production and increased production.
Reading different stellar clocks
Different spectral features preserve information over different timescales. Hydrogen emission lines respond mainly to massive, short-lived stars formed within roughly five million years. Ultraviolet light persists for tens of millions of years after a burst. The Balmer break, a change in the continuum around a particular wavelength, helps identify contributions from older stars.
Consequently, two equally ultraviolet-bright galaxies can have very different recent histories. One might be actively bursting, with strong hydrogen lines. Another might retain ultraviolet light from an earlier episode while producing few new massive stars.
The authors classify strong recent increases using the ratio of star-formation rates averaged over three and 50 million years: an upturn exceeds five, while a downturn falls below 0.2.
Their mass-dependent model broadly reproduces galaxy counts through redshift 10–11 and several observed spectral trends. A comparison model with mass-independent fluctuations misses the observed rise in downturn fractions toward fainter galaxies.
The prediction that separates the models
The calibrated model nevertheless underpredicts bright galaxies at redshift 14. The researchers therefore tested two modifications: increasing the median-efficiency normalization fivefold, or increasing burstiness enough to produce about 1.4 magnitudes of ultraviolet scatter at the reference halo mass.
Both can reproduce the targeted redshift-14 galaxy counts. Their predicted spectra differ.
At fixed ultraviolet brightness, the stronger-burstiness scenario predicts roughly twice the downturn fraction at redshift 14 compared with redshift 10. The increased-efficiency scenario predicts little change.
A related distinction concerns weak hydrogen emission. The burstier model predicts about a 50% increase in the fraction with Hβ equivalent widths below 50 angstroms. Equivalent width measures a line’s strength relative to its surrounding continuum. The efficiency model instead predicts this weak-emitter fraction will decline.
These are model predictions, not population changes already established by observations.
A test with important caveats
Weak emission lines do not uniquely identify fading star formation. Ionizing photons escaping a galaxy, or differential dust obscuration, can also weaken them. The calculations assume complete absorption of ionizing photons, fixed stellar metallicity and a standard stellar mass distribution; they omit binary-star evolution and neglect dust attenuation above redshift 10.
The model also underproduces downturns in the faintest calibration bin by about a factor of 1.5, suggesting its single variability timescale may miss longer suppression episodes. Its predicted ultraviolet-slope variation explains only part of the observed diversity.
Testing the proposal requires representative samples spanning brightness and redshift, combining emission lines with continuum and Balmer-break measurements. At the highest redshifts, JWST’s MIRI instrument can supply complementary Hα and continuum observations beyond NIRSpec’s wavelength reach. The promising discriminator is not one unusual galaxy, but whether fading systems become systematically more common.
- JWST
- early galaxies
- bursty star formation
- galaxy formation
- spectroscopy
- ultraviolet luminosity function
- Balmer break
Related reading
Automatically matched by shared topic keywords. These links do not imply that the sources agree or establish a consensus.
Five observations that could sharpen our picture of early galaxies
Source published
Shared keywords: galaxy formation
Early Galaxies Narrow a Search for Neutrino Interactions
Source published
Shared keywords: early galaxies, ultraviolet luminosity function
Why Astronomers Want a Bigger JWST Survey of the First Galaxies
Source published
Shared keywords: galaxy formation
JWST probes the chemistry of tiny early galaxies—and a nitrogen puzzle
Source published
Shared keywords: early galaxies
What Star Clusters Could Reveal About Faint Galaxies
Source published
Shared keywords: galaxy formation