TRANSMISSION // 2611.00405v1
Behavior graphs turn robot deployment recordings into maps of success and failure
Source published
A preprint introduces graphs that organize robot task attempts into recurring behaviors and outcomes. In an 18-person study, participants preferred the graphs and reported less time pressure and effort than with videos, while making comparable data-collection choices. The same representation also improved retrospective progress estimates across 43 datasets.
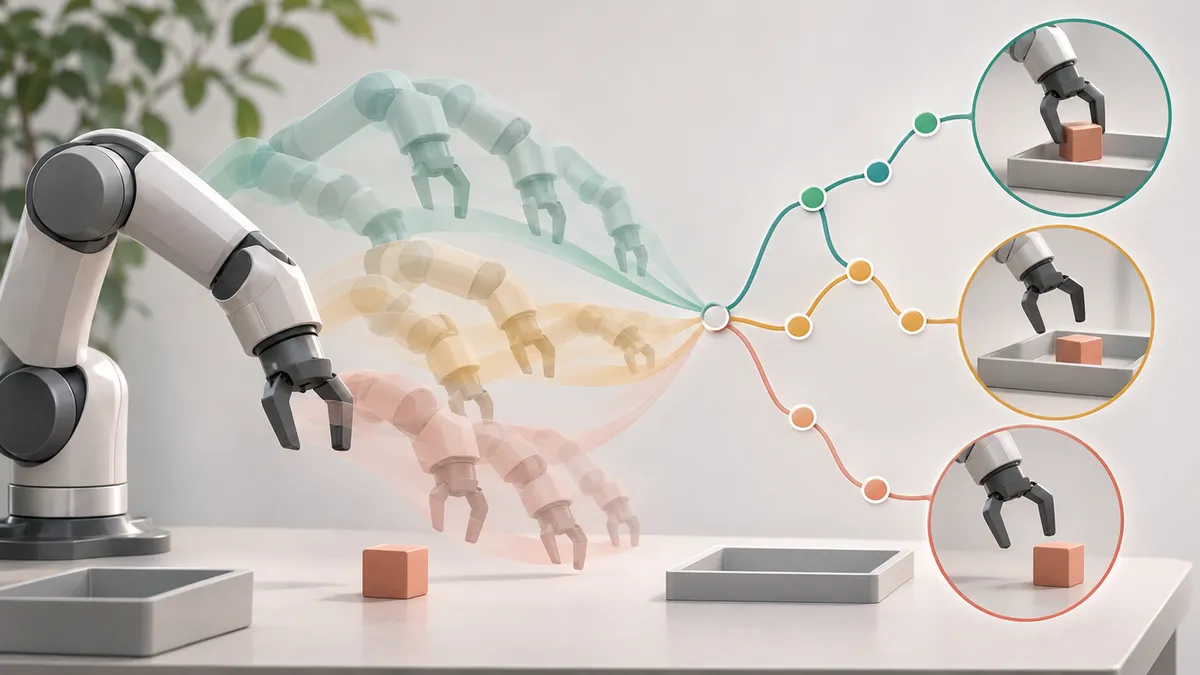
When a robot repeatedly fails a task, deciding what to teach it next can mean reviewing many recordings. Erik Bauer and colleagues propose behavior graphs: visual summaries that group similar actions, show how they connect, and reveal which behaviors are associated with unsuccessful attempts.
A robot’s deployment recordings can show much more than whether it completed a task. They can reveal repeated grasping problems, alternative execution strategies, or failures associated with particular starting conditions. The difficulty is finding those patterns across many attempts.
In the preprint Behavior Graphs: Unsupervised Graph Structures for Interpreting Robot Deployment Data, submitted to arXiv on October 30, 2026, Erik Bauer and colleagues propose compressing those attempts into a directed graph. Their aim is to help people interpret robot behavior and decide which demonstrations to collect next—not to replace the robot’s controller.
Turning recordings into a shared map
Each recorded task attempt, or rollout, becomes a sequence of recurring behaviors. By default, the method uses representations from the trained robot policy’s observation encoder. It averages these representations over sliding time windows, reduces their dimensionality with UMAP, and groups similar windows using K-means clustering.
Consecutive windows assigned to the same cluster become a segment. Across recordings, the resulting behavior sequences are combined into a graph with starting, behavior, success, and failure nodes. Edges describe observed transitions, weighted by their empirical frequency.
The behavior discovery is unsupervised, but the complete analysis still uses a success-or-failure annotation for each trajectory. A vision-language model supplies readable behavior captions from sampled images and the graph’s structure. Those captions describe discovered clusters rather than defining the behaviors in advance.
Node size indicates how many trajectories visited a behavior; color indicates the fraction of those trajectories that ultimately succeeded. Users can select nodes or transitions to inspect the associated videos. These associations help locate failure-prone patterns, but do not by themselves establish what caused a failure.
Less demanding analysis, comparable decisions
The researchers tested the interface with 18 participants analyzing three real-world manipulation tasks: setting a table, preparing a tray, and cooking. Each participant examined 60 rollouts per task. For the first two tasks, participants used a graph or a video browser under the randomized study design. For the third, they chose their preferred display; 16 selected the graph.
Participants chose among candidate strategies for collecting additional demonstrations. To assess those choices, the team had already collected 30 demonstrations per candidate strategy, retrained the policies, and evaluated their success rates. A participant’s decision was scored by its gap from the best available retrained policy.
After adjustment for task, study stage, experience, and individual rating differences, perceived temporal demand was 40.3% lower with graphs, and reported effort was 37.6% lower. These are subjective workload reductions, not measured reductions in elapsed analysis time. Confidence and the quality of selected strategies showed no reliable difference between displays.
The retraining experiments also illustrate why targeting matters. For table setting, only demonstrations covering the milk carton’s leftmost position—absent from the original training data—improved performance. In cooking, none of the individual-subtask collection strategies produced a statistically significant improvement. The study therefore supports easier analysis, not a claim that graph users consistently choose better training data than video users.
Estimating progress without another neural network
The authors also use the discovered behaviors to estimate how far a recorded attempt has progressed. Successful rollouts determine each behavior’s share of total progress and its position in the sequence. Progress then increases linearly within each behavior segment. This requires lightweight parameter fitting, but no additional neural-network training or manually annotated subtasks.
Across 43 datasets from LIBERO, Robomimic, MimicGen, and a real-world DROID setup, the graph method achieved the best average progress-fidelity metrics among the tested approaches. Average value-order correlation rose from 0.769 for the strongest baseline on that metric to 0.945, a 22.9% relative improvement. Mean absolute error fell from 0.155 to 0.072, a 53.5% reduction.
Those comparisons used a linear progress ramp on successful rollouts as the reference, rather than independently measured physical task completion. Performance was not uniformly best: an MLP using the same policy representations slightly led on correlation and error in LIBERO. Robometer was strongest on average at classifying final success or failure.
What remains limited
The progress estimator is non-causal: its current formulation uses information unavailable at the current instant during execution. It would need adaptation for live monitoring. Graph quality also depends substantially on the underlying representation and the chosen number of behavior clusters.
The authors evaluated segmentation as a proxy for graph quality and lacked subtask annotations for most datasets. Their evidence points to a useful retrospective analysis tool: a structured way to inspect deployment behavior with less reported burden, while leaving broader claims about better decisions and continuous robot improvement unproven.
- robotics
- behavior graphs
- deployment data
- imitation learning
- unsupervised clustering
- robot interpretability
- progress estimation
- data collection