TRANSMISSION // 2610.33376v2
Infrared spectra reveal contrasting gas regions in nova V5668 Sgr
Source published
Observations taken more than a year after V5668 Sgr erupted support a model with two gas components of different densities and compositions. Large inferred elemental enrichments remain uncertain because most depend on a single spectral line.
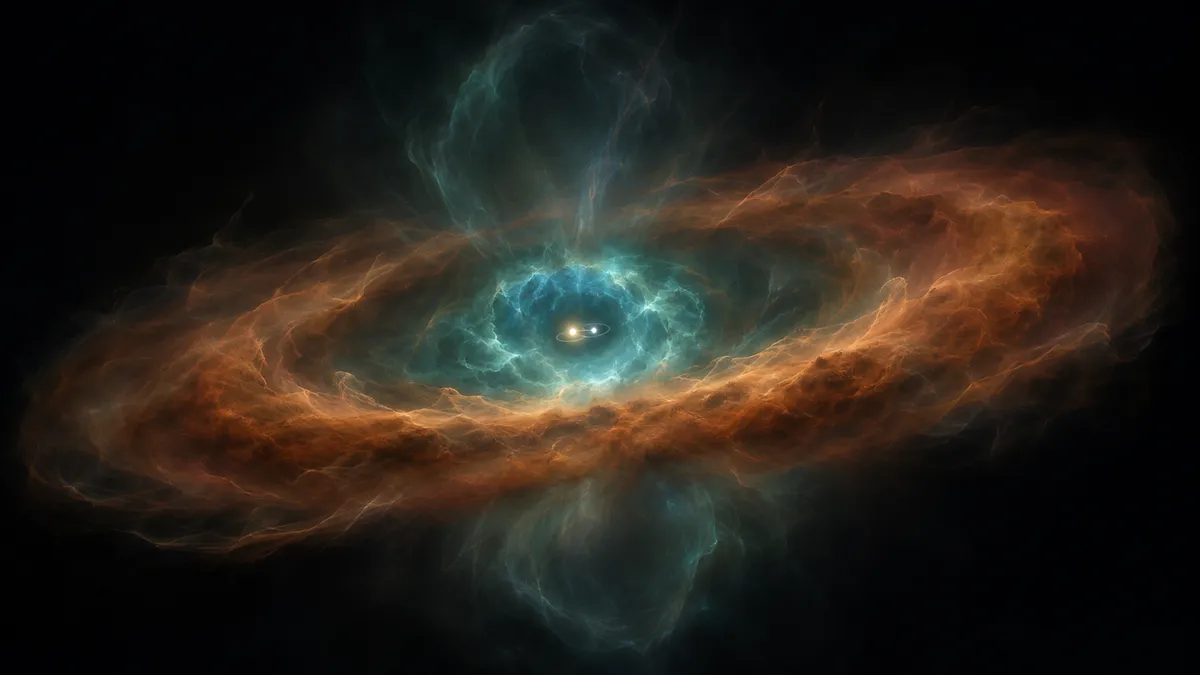
The material expelled by a nova does not necessarily form a uniform cloud. Infrared observations of V5668 Sgr, which erupted in March 2015, show emission from gas under contrasting conditions. Researchers combined these measurements with radiation models to investigate the ejecta’s structure and chemistry, while identifying substantial limits on the inferred abundances.
Examining the aftermath
A classical nova erupts when material accumulated from a companion star on a white dwarf ignites in a thermonuclear runaway. The eruption ejects chemically enriched material into the surrounding space. Studying that gas helps astronomers investigate both the eruption and the elements it releases.
Sarah H. Taft and colleagues examined V5668 Sgr using infrared spectra obtained roughly 15–18 months after its March 2015 eruption. Their paper is available as an arXiv manuscript; the accompanying record states that it has been accepted for publication in the Astronomical Journal. Its publication status is therefore not inferred merely from its presence on arXiv.
Combining observations across wavelengths
The team analyzed a near-infrared spectrum taken at Mount Abu Observatory 450 days after the eruption. It covered wavelengths from 0.85 to 2.4 micrometers and contained 34 emission features, of which 30 were identified. These included hydrogen and helium lines, alongside features associated with heavier elements. Some lines had two peaks.
They also analyzed SOFIA observations taken 490 and 556 days after the eruption. These showed emission from singly ionized neon at 12.8 micrometers. The earlier SOFIA observation also covered the 25.9-micrometer line of triply ionized oxygen; the later observation did not cover that wavelength. Features at 6.2 and 11.3 micrometers were attributed to polycyclic aromatic hydrocarbons, while a feature near 5.6 micrometers remained unidentified.
To measure line strengths, the researchers subtracted the nearby background spectrum and fitted single- or double-peaked Gaussian profiles. They excluded several identified features from modeling, including oxygen lines mainly produced by fluorescence and a doubtful phosphorus identification.
The observations were not simultaneous. To combine the Mount Abu measurements with the first SOFIA epoch, the team reduced the earlier line fluxes by 18%, using the nova’s decline in two optical brightness bands. No longer-wavelength light curves were available to check whether this correction represented the infrared evolution.
Two components fit different emission
The researchers used Cloudy, a program that calculates how gas responds to radiation and produces a spectrum. They varied the illuminating white dwarf’s temperature and luminosity, then adjusted gas density and elemental abundances to improve agreement with the measured lines.
Within their modeling framework, one component could not adequately reproduce the combined spectrum. Two components were needed, differing in hydrogen density and chemical composition while sharing other parameters.
The denser component primarily produced hydrogen and helium recombination emission and lower-ionization forbidden lines. The less dense component accounted for higher-ionization titanium, silicon and oxygen lines. Their fitted hydrogen densities at the inner boundary were approximately 400 million and 25 million atoms per cubic centimeter, respectively; density decreased outward in the adopted model.
The model favored a white dwarf temperature of 170,000 kelvin, the lowest temperature available in the atmosphere grid they explored. This boundary matters: the result does not establish that cooler illuminating sources would fit worse.
Enrichment with substantial uncertainty
Relative to the adopted solar composition, the fitted abundances were 1.5 times solar for helium, 1,300 for nitrogen, 390 for neon and 120 for sulfur in the denser component. The other component required titanium at 8.3 times solar, silicon at 1,400 and oxygen at 140.
These are model-dependent abundance estimates, not direct counts of atoms. Helium was constrained by eight lines, but most heavier elements relied on only one line each. Sulfur used two, including a blended feature. The authors emphasize that several enrichments greatly exceed values commonly reported for comparable novae and require additional spectral constraints.
The fit also left substantial discrepancies. For example, modeled oxygen emission at 25.9 micrometers was about one-third of the observed value. The reported reduced chi-squared was 3.38, indicating that the model did not reproduce every measurement within its stated uncertainty.
Visualizing an assumed structure
Using pyCloudy, the team assembled one-dimensional calculations into pseudo-three-dimensional emission maps. These assumed axial symmetry and drew on earlier evidence for bipolar ejecta with an equatorial waist; they were not direct images establishing that geometry independently.
The maps placed denser-component emission in an extended equatorial region, with more compact higher-ionization emission. The inferred total expelled mass was about 0.0000126 solar masses, conditional on the adopted geometry, distance, density distribution and composition.
The study supports a physically varied, dusty ejecta rather than a single uniform gas component. Its strongest caution concerns the chemistry: more lines are needed before the exceptionally large heavy-element enrichments can be treated as securely measured.
- V5668 Sgr
- classical nova
- infrared spectroscopy
- photoionization modeling
- stellar ejecta
- elemental abundances
- Cloudy
Related reading
Automatically matched by shared topic keywords. These links do not imply that the sources agree or establish a consensus.
Webb separates the dust signals around Tc 1’s carbon cages
Source published
Shared keywords: infrared spectroscopy
Webb traces free-floating carbon cages around Tc 1
Source published
Shared keywords: infrared spectroscopy
Webb detects a long-sought rotational signal from a key interstellar ion
Source published
Shared keywords: infrared spectroscopy
Measuring the stars behind JWST’s planet spectra
Source published
Shared keywords: infrared spectroscopy
Reading the Ingredients of Planets in M-Dwarf Starlight
Source published
Shared keywords: infrared spectroscopy