TRANSMISSION // 2026.11.04.764277v1
Palm flower shapes offer clues, not clear boundaries, to Peruvian species
Source published
A preprint analysing 549 female flowers from 11 Peruvian palm species finds that combining calyx and corolla shapes improves species assignment, but extensive overlap and conflicting statements within the manuscript limit firm taxonomic conclusions.
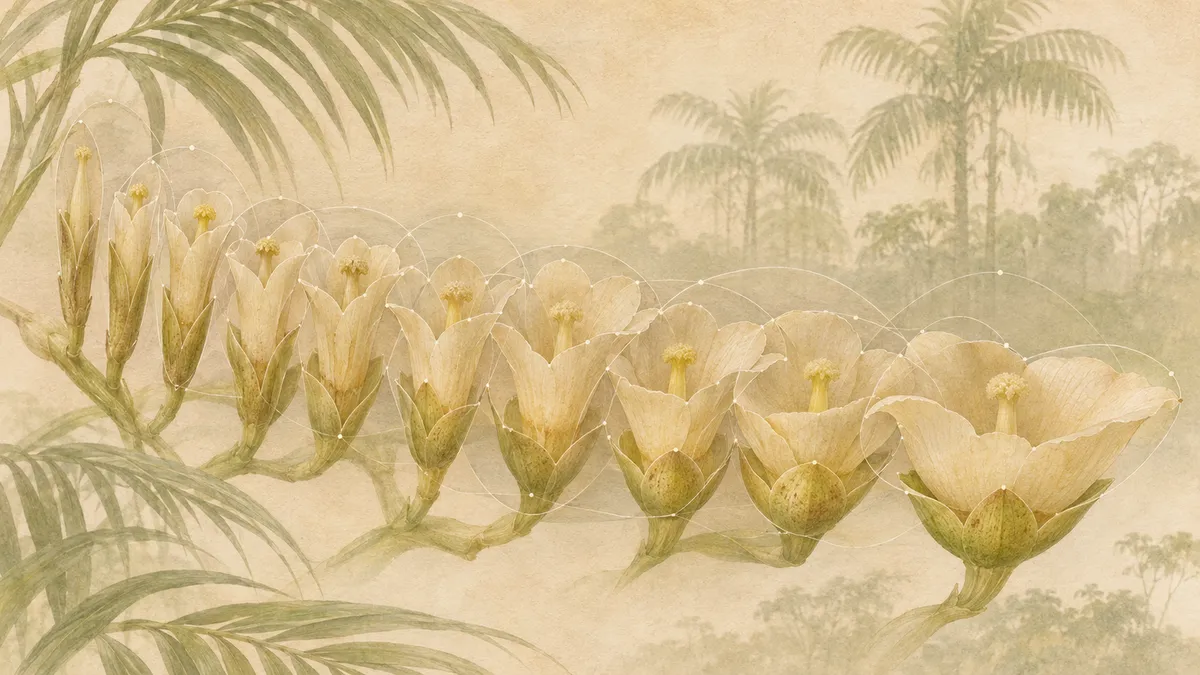
The outlines of Amazonian palm flowers contain information that traditional shape labels can miss. Yet a study of Peru’s Huicungo palms also shows why measuring those outlines cannot, by itself, settle where one species ends and another begins.
Amazonian palms in the group Astrocaryum section Huicungo pose a classification puzzle. Traditional subdivisions rely partly on female flower characteristics, including the relative lengths of floral structures and the presence of prickles or bristles. Previous genetic studies, as described by the authors, have challenged whether those subdivisions reflect evolutionary relationships. A new bioRxiv preprint asks what a more detailed measurement of flower shape can contribute.
Valeria Meza, Gabriel Moreno, Marcelo Daza and Betty Millán examined the 11 species found in Peru. Their study, posted on November 6, 2026, has not been certified by peer review. It finds useful statistical differences alongside considerable overlap: flower geometry supplies evidence for classification, not an unambiguous identification system.
Turning flower outlines into measurements
The researchers studied 549 female, or pistillate, flowers from 61 individuals represented in the San Marcos Herbarium. They selected specimens with complete inflorescences and flowers collected during anthesis, the flowering stage, to avoid changes associated with fertilization. Sampling covered basal, middle and apical positions. Species samples were unequal, ranging from 18 to 90 flowers.
They analysed the calyx and corolla, the two structures that together form the perianth surrounding the reproductive organs. After removing prickles and bristles to expose the outlines, they photographed the structures under a stereomicroscope with standardized orientation and a scale. Four landmarks and 16 additional points following the curves represented each outline in two dimensions.
A mathematical alignment removed differences in size, position and rotation. The team then separated left–right asymmetry from the symmetric component of shape, using only the latter for subsequent species comparisons. Principal component analysis summarized the main patterns of variation; canonical variate analysis assessed separation among the named species. They also calculated cross-validated classification rates and constructed clusters based on shape distances.
Useful differences within a continuum
The flowers did not fall into neatly separated shape categories. Instead, much of the variation ran from long, narrow outlines to shorter, broader ones, with additional changes in the width of the base and opening. Astrocaryum perangustatum had particularly slender, tubular forms, whereas A. ulei and A. chonta had shorter calyces with broad openings. Mean shapes could differ even where individual flowers overlapped substantially.
Species identity accounted for 46.9% of calyx shape variation and 44.0% of corolla variation in the hierarchical analysis. Differences among individuals within species also mattered, accounting for 31.0% and 27.3%, respectively. Flower position explained much smaller shares: 0.6% for the calyx and 2.8% for the corolla. These results show that species-associated differences coexist with substantial variation within species.
The cross-validated classification results make that balance concrete. Calyx shape alone assigned 44.26% of flowers to the correct species; corolla shape assigned 53.92%. Combining both structures raised the reported rate to 64.85%. That was the best of the three approaches, but still left roughly one-third of flowers incorrectly assigned. It should not be read as near-certain identification.
Shape-based clusters also failed to reproduce the traditional subsections. A. carnosum, A. faranae and A. huicungo consistently showed close geometric similarity. However, the manuscript contains an important inconsistency: its results and Table 3 report no significant pairwise differences within this trio in the combined analysis, while the discussion and conclusion claim that the combined data distinguish A. carnosum from the other two. That conflict prevents a firm conclusion about this particular separation.
What shape cannot establish
Asymmetry was another substantial component of the original measurements, accounting for about 19.4% of calyx variation and 30.5% of corolla variation as fluctuating asymmetry. The authors suggest that crowding during flower development, and potentially chewing by pollinating beetles, could contribute. Their measurements do not establish those mechanisms: these are proposed explanations, not experimentally demonstrated causes.
The authors also acknowledge statistical limitations. Multiple flowers came from the same individuals, creating a risk of pseudoreplication that could inflate significance. High-dimensional shape measurements can produce apparent distances between otherwise similar distributions. A statistically significant distance therefore does not demonstrate a biological barrier between species.
Likewise, a tree grouping similar outlines is not itself an evolutionary family tree. The authors discuss recent divergence and shared ancestral traits as possible explanations for similarities, but the shape analysis alone does not establish that history. Their broader recommendation is to combine quantitative floral measurements with ecological and genomic evidence. The preprint supports that cautious direction while leaving several species boundaries unresolved.
- Astrocaryum
- Huicungo palms
- floral morphology
- geometric morphometrics
- plant taxonomy
- Peruvian Amazon
- species delimitation