TRANSMISSION // 2026.11.03.763633v1
Field photos reveal buckwheat’s flowering diversity and candidate genetic links
An unreviewed preprint describes a workflow that extracts flowering traits from buckwheat field images, including smartphone photographs. Across five trials conducted in 2023 and 2024, the approach captured differences in flowering timing and intensity and identified genetic associations that could guide further breeding research.
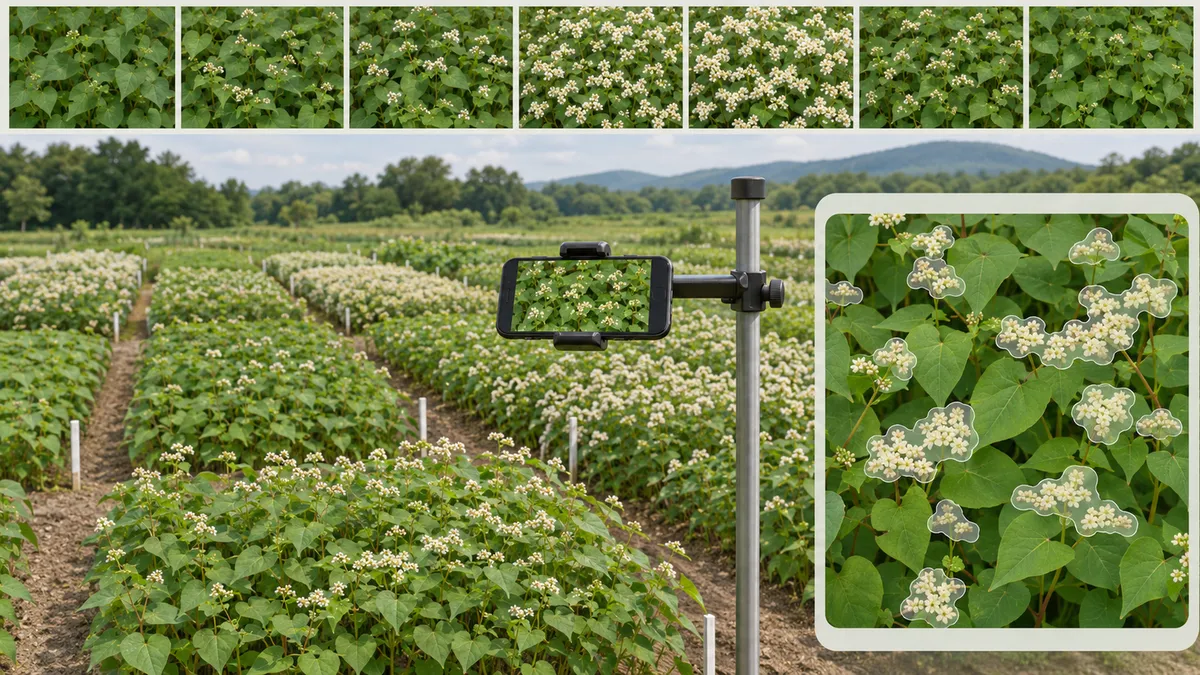
Common buckwheat can carry flowers, developing seeds and ripe seeds at the same time, making harvest timing difficult. Researchers have combined repeated field photography, automated flower detection and statistical modelling to measure that overlapping development—and investigate genetic variation associated with it.
Common buckwheat’s prolonged flowering creates a practical trade-off. Harvest too early, and flowers and unripe seeds remain; wait longer, and mature seeds risk scattering or sprouting before harvest. Yet sustained flowering also supplies nectar and pollen for insects. Breeders therefore need ways to identify flowering patterns suited to different uses, rather than simply selecting for the shortest flowering season.
An unreviewed bioRxiv preprint by Carles Quesada-Traver, Fabian Hess and colleagues presents an image-based approach to that task. It combines photographs of field plots with automated image analysis and models of how flower coverage changes over time. The resulting measurements also supplied traits for a search for associated genetic markers.
Turning photographs into flowering measurements
The researchers studied a collection of 169 buckwheat accessions—distinct entries in a germplasm collection—across five field trials in Switzerland and Germany during 2023 and 2024. Four trials grew buckwheat as a main crop; a late-sown Swiss trial used a subset of 55 accessions as a second crop. Although the abstract describes five growing seasons, the methods specify five trials across these two years.
The study reports 37,078 images. Swiss plots were photographed using a prototype phenotyping platform, while the German trials used a Samsung smartphone in 2023 and an Olympus digital camera in 2024. Photography was generally scheduled twice weekly, with interruptions when rain interfered with handling or image quality.
To train the flower-detection system, the team manually outlined flower clusters in 241 image quadrants from the 2023 Swiss trial. They used 192 quadrants for training and 49 for validation. A Mask R-CNN model then identified flower-cluster regions in images, with overlapping predictions merged to prevent duplicate coverage.
The key measurement, called Flower %, was the fraction of image pixels inside those regions. It is a proxy for flowering intensity, not a direct count of individual flowers. After merging overlapping predictions, predicted and manually annotated flower areas had correlations above 0.99 in the training and validation sets. That correlation should not be read as 99% detection accuracy. Images without annotated flowers sometimes still produced predicted coverage, leading the researchers to adopt a 2% threshold for flowering onset.
Capturing timing, intensity and decline
The team smoothed each plot’s observations into daily estimates, then modelled increasing flower coverage with a logistic curve and the post-peak decline with a straight line. From these curves they derived 22 traits covering flowering timing, intensity and what the paper calls abscission, including a projected endpoint of declining flower coverage.
Median model-fit values were 0.98–0.99 for the flowering phase and 0.85–0.91 for the decline phase. Parameters from poorly fitting curves were excluded. Comparisons with manually scored developmental stages were strongest for relevant timing traits: some flowering-time correlations reached 0.92, while correlations involving late developmental stages reached 0.94. Intensity measurements provided complementary information that the manual developmental scale does not capture.
The late-sown second crop progressed through flowering earlier after sowing and showed lower flowering intensity than the main crop. Its projected endpoint of flower decline averaged 79 days after sowing, compared with 124 days for the main crop. These are model-derived flowering endpoints, not direct measurements of harvest readiness. Timing traits were also generally more consistent across environments than flowering duration or intensity-related traits, reinforcing the importance of testing breeding material under its intended growing conditions.
Genetic leads, not proven mechanisms
For the genetic analysis, the researchers used 52,182 markers representing allele frequencies in pooled plant samples from each accession. Genome-wide association analyses accounted for population structure and relatedness. Across the image-derived traits, they identified 343 unique associated markers; 265 overlapped 171 annotated genes.
Highlighted candidates included genes annotated as an auxin response factor and an ethylene-insensitive protein, associated with mid-flowering timing and the rate of flower-coverage decline, respectively. A marker within the auxin-response-factor candidate explained roughly 35–40% of variation in mid-flowering in the reported marker-effect models. These are statistical associations and annotation-based candidates, not demonstrations that changing those genes will produce the desired buckwheat traits.
The workflow also has a clear modelling limit. Some plots flowered again after hot, dry weather followed by heavy rain in 2023, which a single straight-line decline could not adequately represent. Functional validation of candidate genes and broader environmental testing remain important next steps. The immediate contribution is a way to quantify flowering diversity using different imaging setups—not a demonstrated improvement in yield or a finished set of breeding tools.
- common buckwheat
- image-based phenotyping
- flowering dynamics
- Mask R-CNN
- smartphone imaging
- genome-wide association study
- plant breeding
- preprint